


facet_wrap与 ggplot2:边框粗细各不相同
我在对数据进行分面显示时遇到了一个问题,图的边框厚度明显不同。我不确定原因是什么。
我的绘图代码在这里。我使用ggh4x的 facet_wrap2来为分面着色。
数据
new_data_bin_hw <- structure(list(heatwave = c(0, 1, 0, 1, 0, 1, 0, 1), season2 = structure(c(1L, 1L, 2L, 2L, 3L, 3L, 4L, 4L), levels = c("Spring", "Summer", "Autumn", "Winter"), class = "factor"), TL = c(962L, 962L, 962L, 962L, 962L, 962L, 962L, 962L), lunar_day = c(16.6006576568519, 16.6006576568519, 16.6006576568519, 16.6006576568519, 16.6006576568519, 16.6006576568519, 16.6006576568519, 16.6006576568519), hour_of_day = c(12L, 12L, 12L, 12L, 12L, 12L, 12L, 12L), Transmitter = structure(c(1L, 1L, 1L, 1L, 1L, 1L, 1L, 1L), levels = c("Eel001", "Eel002", "Eel003", "Eel004", "Eel005", "Eel006", "Eel007", "Eel008", "Eel009", "Eel010", "Eel011", "Eel012", "Eel013", "Eel014", "Eel015", "Eel016", "Eel017", "Eel018", "Eel019", "Eel020", "Eel021", "Eel022", "Eel023", "Eel024", "Eel025", "Eel026", "Eel027", "Eel028", "Eel029", "Eel030", "Eel031", "Eel032", "Eel033", "Eel034", "Eel035", "Eel036", "Eel037", "Eel038", "Eel039", "Eel040", "Eel041", "Eel042", "Eel043", "Eel044", "Eel045", "Eel047", "Eel048", "Eel049", "Eel050", "Eel051", "Eel052", "Eel053", "Eel054", "Eel055", "Eel056", "Eel057", "Eel058", "Eel059", "Eel060", "Eel061", "Eel062", "Eel063", "Eel064", "Eel065", "Eel066", "Eel067", "Eel068", "Eel069", "Eel070", "Eel071", "Eel072", "Eel073", "Eel074", "Eel075", "Eel076", "Eel077", "Eel078", "Eel079", "Eel080", "Eel081", "Eel082", "Eel083", "Eel084", "Eel085", "Eel086", "Eel087", "Eel088", "Eel089", "Eel090", "Eel091", "Eel093", "Eel094", "Eel095", "Eel096", "Eel097", "Eel098", "Eel099", "Eel100", "Eel101", "Eel103", "Eel104", "Eel105", "Eel106", "Eel107", "Eel108", "Eel109", "Eel110", "Eel111", "Eel112", "Eel113", "Eel114", "Eel115", "Eel116", "Eel117", "Eel118", "Eel119", "Eel120", "Eel121", "Eel122", "Eel123", "Eel124", "Eel125", "Eel126", "Eel127", "Eel128", "Eel129", "Eel130", "Eel131", "Eel132", "Eel133", "Eel134", "Eel135", "Eel136", "Eel137", "Eel138", "Eel139", "Eel140", "Eel141", "Eel142", "Eel143", "Eel144", "Eel145", "Eel146", "Eel147", "Eel148", "Eel149", "Eel150", "Eel151", "Eel152", "Eel153", "Eel154", "Eel155", "Eel156", "Eel157", "Eel158", "Eel159", "Eel160", "Eel161", "Eel162", "Eel163", "Eel164", "Eel165", "Eel166", "Eel167", "Eel168", "Eel169", "Eel170", "Eel171", "Eel172", "Eel173", "Eel175", "Eel176", "Eel177", "Eel178", "Eel179", "Eel180", "Eel181", "Eel182", "Eel183", "Eel184", "Eel185"), class = "factor"), heatwave_event = structure(c(1L, 1L, 1L, 1L, 1L, 1L, 1L, 1L), levels = c("1", "2", "3", "4", "5", "6", "7", "8", "9", "10", "11"), class = "factor"), heatwave_label = structure(c(1L, 2L, 1L, 2L, 1L, 2L, 1L, 2L), levels = c("non-Heatwave", "Heatwave" ), class = "factor"), pred_prob = c(`1` = 0.961627566209907, `2` = 0.955343989430363, `3` = 0.895096723090536, `4` = 0.875158203607029, `5` = 0.922523984492865, `6` = 0.908513887249218, `7` = 0.83852609394597, `8` = 0.944225811707875), upper_ci = c(`1` = 0.976898968982644, `2` = 0.972112073891751, `3` = 0.926556518537287, `4` = 0.913589226768604, `5` = 0.946498411959461, `6` = 0.936510907213453, `7` = 0.895983946257647, `8` = 0.965301792855708), lower_ci = c(`1` = 0.936912651685311, `2` = 0.92922781378224, `3` = 0.852309035256633, `4` = 0.822947490839364, `5` = 0.889065598367977, `6` = 0.869886197874142, `7` = 0.757904854009687, `8` = 0.911521495666282)), row.names = c(NA, -8L), out.attrs = list( dim = c(heatwave = 2L, season2 = 4L), dimnames = list(heatwave = c("heatwave=0", "heatwave=1"), season2 = c("season2=Spring", "season2=Summer", "season2=Autumn", "season2=Winter"))), class = "data.frame")
new_data_spd_hw <- structure(list(heatwave = c(0, 1, 0, 1, 0, 1, 0, 1), season2 = structure(c(1L, 1L, 2L, 2L, 3L, 3L, 4L, 4L), levels = c("Spring", "Summer", "Autumn", "Winter"), class = "factor"), TL = c(962, 962, 962, 962, 962, 962, 962, 962), lunar_day = c(16.7230106290296, 16.7230106290296, 16.7230106290296, 16.7230106290296, 16.7230106290296, 16.7230106290296, 16.7230106290296, 16.7230106290296), hour_of_day = c(12, 12, 12, 12, 12, 12, 12, 12), Transmitter = structure(c(1L, 1L, 1L, 1L, 1L, 1L, 1L, 1L), levels = c("Eel001", "Eel002", "Eel003", "Eel004", "Eel005", "Eel006", "Eel007", "Eel008", "Eel009", "Eel010", "Eel011", "Eel012", "Eel013", "Eel014", "Eel015", "Eel016", "Eel017", "Eel018", "Eel019", "Eel020", "Eel021", "Eel022", "Eel023", "Eel024", "Eel025", "Eel026", "Eel027", "Eel028", "Eel029", "Eel030", "Eel031", "Eel032", "Eel033", "Eel034", "Eel035", "Eel036", "Eel037", "Eel038", "Eel039", "Eel040", "Eel041", "Eel042", "Eel043", "Eel044", "Eel045", "Eel047", "Eel048", "Eel049", "Eel050", "Eel051", "Eel052", "Eel053", "Eel054", "Eel055", "Eel056", "Eel057", "Eel058", "Eel059", "Eel060", "Eel061", "Eel062", "Eel063", "Eel064", "Eel065", "Eel066", "Eel067", "Eel068", "Eel069", "Eel070", "Eel071", "Eel072", "Eel073", "Eel074", "Eel075", "Eel076", "Eel077", "Eel078", "Eel079", "Eel080", "Eel081", "Eel082", "Eel083", "Eel084", "Eel085", "Eel086", "Eel087", "Eel088", "Eel089", "Eel090", "Eel091", "Eel093", "Eel094", "Eel095", "Eel096", "Eel097", "Eel098", "Eel099", "Eel100", "Eel101", "Eel103", "Eel104", "Eel105", "Eel106", "Eel107", "Eel108", "Eel109", "Eel110", "Eel111", "Eel112", "Eel113", "Eel114", "Eel115", "Eel116", "Eel117", "Eel118", "Eel119", "Eel120", "Eel121", "Eel122", "Eel123", "Eel124", "Eel125", "Eel126", "Eel127", "Eel128", "Eel129", "Eel130", "Eel131", "Eel132", "Eel133", "Eel134", "Eel135", "Eel136", "Eel137", "Eel138", "Eel139", "Eel140", "Eel141", "Eel142", "Eel143", "Eel144", "Eel145", "Eel146", "Eel147", "Eel148", "Eel149", "Eel150", "Eel151", "Eel152", "Eel153", "Eel154", "Eel155", "Eel156", "Eel157", "Eel158", "Eel159", "Eel160", "Eel161", "Eel162", "Eel163", "Eel164", "Eel165", "Eel166", "Eel167", "Eel168", "Eel169", "Eel170", "Eel171", "Eel172", "Eel173", "Eel175", "Eel176", "Eel177", "Eel178", "Eel179", "Eel180", "Eel181", "Eel182", "Eel183", "Eel184", "Eel185"), class = "factor"), heatwave_event = structure(c(1L, 1L, 1L, 1L, 1L, 1L, 1L, 1L), levels = c("1", "2", "3", "4", "5", "6", "7", "8", "9", "10", "11"), class = "factor"), heatwave_label = structure(c(1L, 2L, 1L, 2L, 1L, 2L, 1L, 2L), levels = c("non-Heatwave", "Heatwave" ), class = "factor"), pred_speed = c(`1` = 0.433979026375634, `2` = 0.425854058367608, `3` = 0.316427469907362, `4` = 0.25160964244507, `5` = 0.347116035661599, `6` = 0.295523694490404, `7` = 0.302274987911656, `8` = 0.469728040899192), upper_ci = c(`1` = 0.545633690815147, `2` = 0.534183412879381, `3` = 0.391883374763613, `4` = 0.313262729435615, `5` = 0.430589714483951, `6` = 0.366638720641387, `7` = 0.38450890314219, `8` = 0.592307134876665), lower_ci = c(`1` = 0.345172591986718, `2` = 0.339493280127572, `3` = 0.255500360974413, `4` = 0.20209046982829, `5` = 0.279824478292121, `6` = 0.238202484048813, `7` = 0.237628225433323, `8` = 0.372516924775754)), row.names = c(NA, -8L), out.attrs = list( dim = c(heatwave = 2L, season2 = 4L), dimnames = list(heatwave = c("heatwave=0", "heatwave=1"), season2 = c("season2=Spring", "season2=Summer", "season2=Autumn", "season2=Winter"))), class = "data.frame")
代码
library(ggplot2)
library(patchwork)
library(ggh4x)

season_colours <- c(
  "Spring" = "#C3A8C7",   # dusty lilac
  "Summer" = "#5BA88A",   # muted teal-green
  "Autumn" = "#D4A35A",   # warm ochre
  "Winter" = "#B0B0B0"    # neutral grey
)


# Shared clean theme
hw_theme <- theme_classic() +
  theme(
    plot.title       = element_text(face = "bold", hjust = 0.5, size = 13),
    strip.text       = element_text(face = "bold", size = 11),
    strip.background = element_rect(colour = "black", linewidth = 0.6, fill = NA), # outline added; fill set per plot
    axis.title       = element_text(size = 11),
    axis.text        = element_text(size = 10, colour = "black"),
    axis.text.x      = element_blank(),   # remove x tick labels — legend replaces them
    axis.ticks.x     = element_blank(),
    axis.line        = element_line(colour = "black"),
    panel.border     = element_rect(colour = "black", fill = NA, linewidth = 0.6),
    panel.spacing    = unit(2, "lines"),
    legend.position  = "bottom",
    legend.title     = element_blank(),
    legend.text      = element_text(size = 10),
    legend.key.size  = unit(1, "lines"),
    plot.margin      = margin(10, 15, 10, 10)
  )

# Heatwave point/fill colours
hw_colours <- c(
  "non-Heatwave" = "#4E9BB5",
  "Heatwave"     = "#C1553A"
)

# Strip fills matched to season factor levels
strip_fills <- strip_themed(
  background_x = elem_list_rect(
    fill   = season_colours[levels(new_data_bin_hw$season2)],
    colour = "black",
    linewidth = 0.6
  )
)

# -------------------------------------------------
# Plot 1: probability of moving vs heatwave
# -------------------------------------------------
fig_HW_bin_seasonal <- ggplot(new_data_bin_hw,
                              aes(x = heatwave_label, y = pred_prob,
                                  fill = heatwave_label)) +
  geom_errorbar(
    aes(ymin = lower_ci, ymax = upper_ci),
    width = 0.12, linewidth = 0.7, colour = "black"
  ) +
  geom_point(size = 4, shape = 21, colour = "black") +
  facet_wrap2(~ season2, nrow = 2, strip = strip_fills) +
  scale_fill_manual(values = hw_colours) +
  scale_y_continuous(labels = scales::percent_format(accuracy = 1)) +
  labs(x = NULL, y = "Predicted probability of moving") +
  hw_theme

# -------------------------------------------------
# Plot 2: speed vs heatwave
# -------------------------------------------------
fig_HW_spd_seasonal <- ggplot(new_data_spd_hw,
                              aes(x = heatwave_label, y = pred_speed,
                                  fill = heatwave_label)) +
  geom_errorbar(
    aes(ymin = lower_ci, ymax = upper_ci),
    width = 0.12, linewidth = 0.7, colour = "black"
  ) +
  geom_point(size = 4, shape = 21, colour = "black") +
  facet_wrap2(~ season2, nrow = 2, strip = strip_fills) +
  scale_fill_manual(values = hw_colours) +
  labs(x = NULL, y = "Predicted speed [km/h]") +
  hw_theme

# -------------------------------------------------
# Combine with shared legend and centred x label
# -------------------------------------------------
combined_hw_fig <- fig_HW_bin_seasonal + fig_HW_spd_seasonal +
  plot_layout(ncol = 2, guides = "collect") &
  theme(legend.position = "bottom")

combined_hw_fig
并且它生成了这张图像 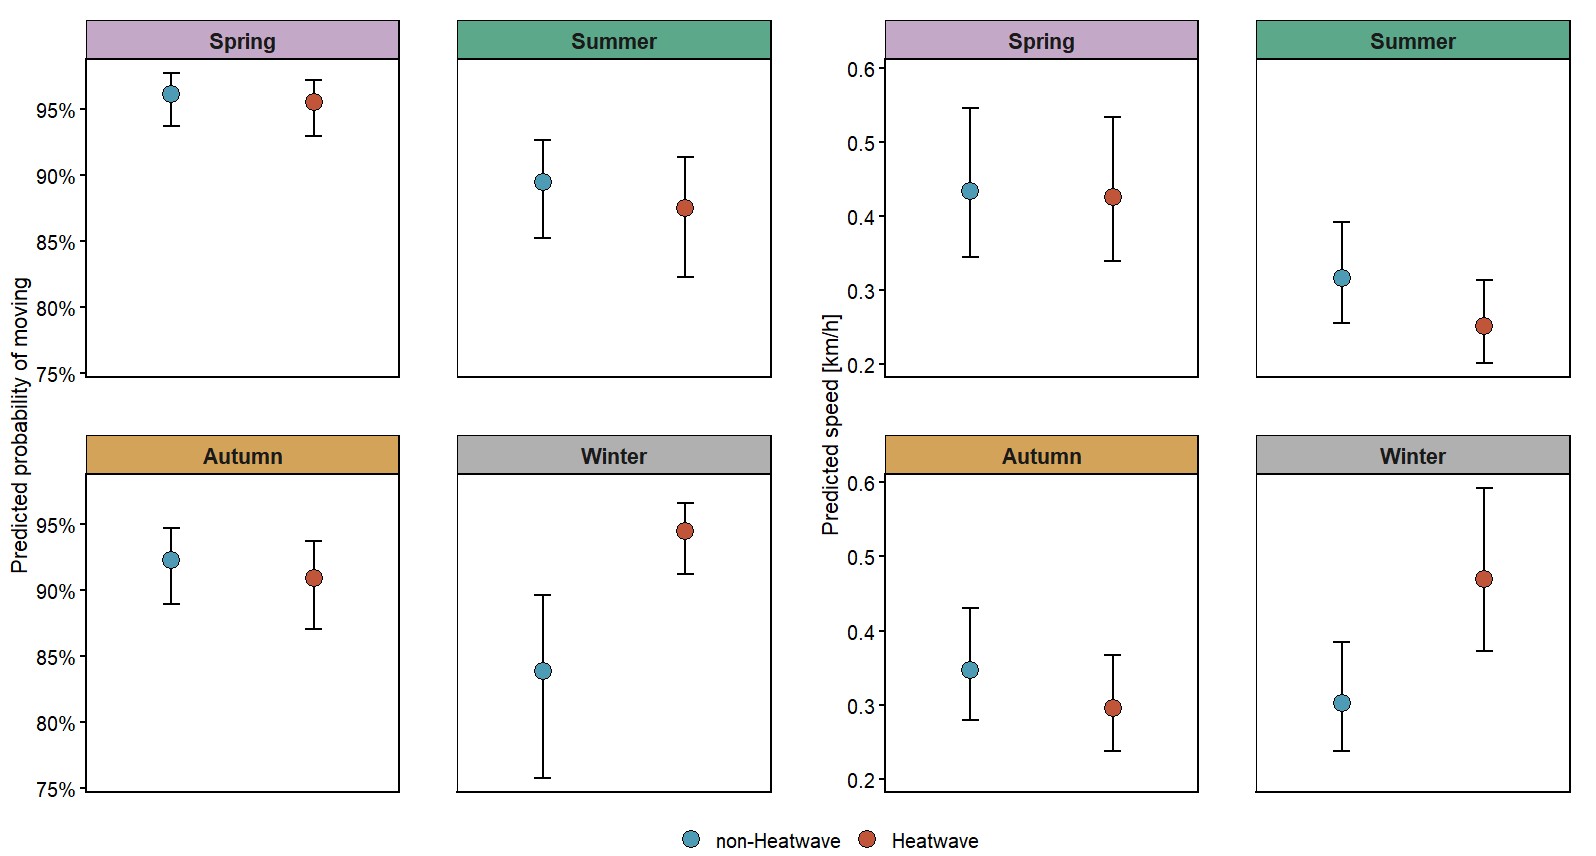
你可以看到夏季和冬季分面的左边框似乎比其他边框更细,分面标题周围的线条粗细也似乎不均匀。这是由什么原因造成的,应该如何解决?
解决方案
[...] 以及围绕分面标题的线条粗细似乎也不均匀。这是由什么原因造成的,应该如何解决?
原因是什么
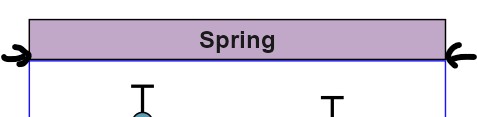
panel.border = element_rect(colour = "blue", fill = NA, linewidth = 0.6)
在绘图区的面板周围绘制一个边框
并且
strip.background = element_rect(colour = "black", linewidth = 0.6, fill = NA)
对“分面标题”也执行相同的操作,恰好它们会重叠:
修复方法
修复这个问题的一种方法是将矩形的面板边框
panel.border = element_blank()
替换成一个U 形的边框
u_panel <- annotate("path", x = c(-Inf, -Inf, Inf, Inf), y = c(Inf, -Inf, -Inf, Inf), linewidth = 0.6)
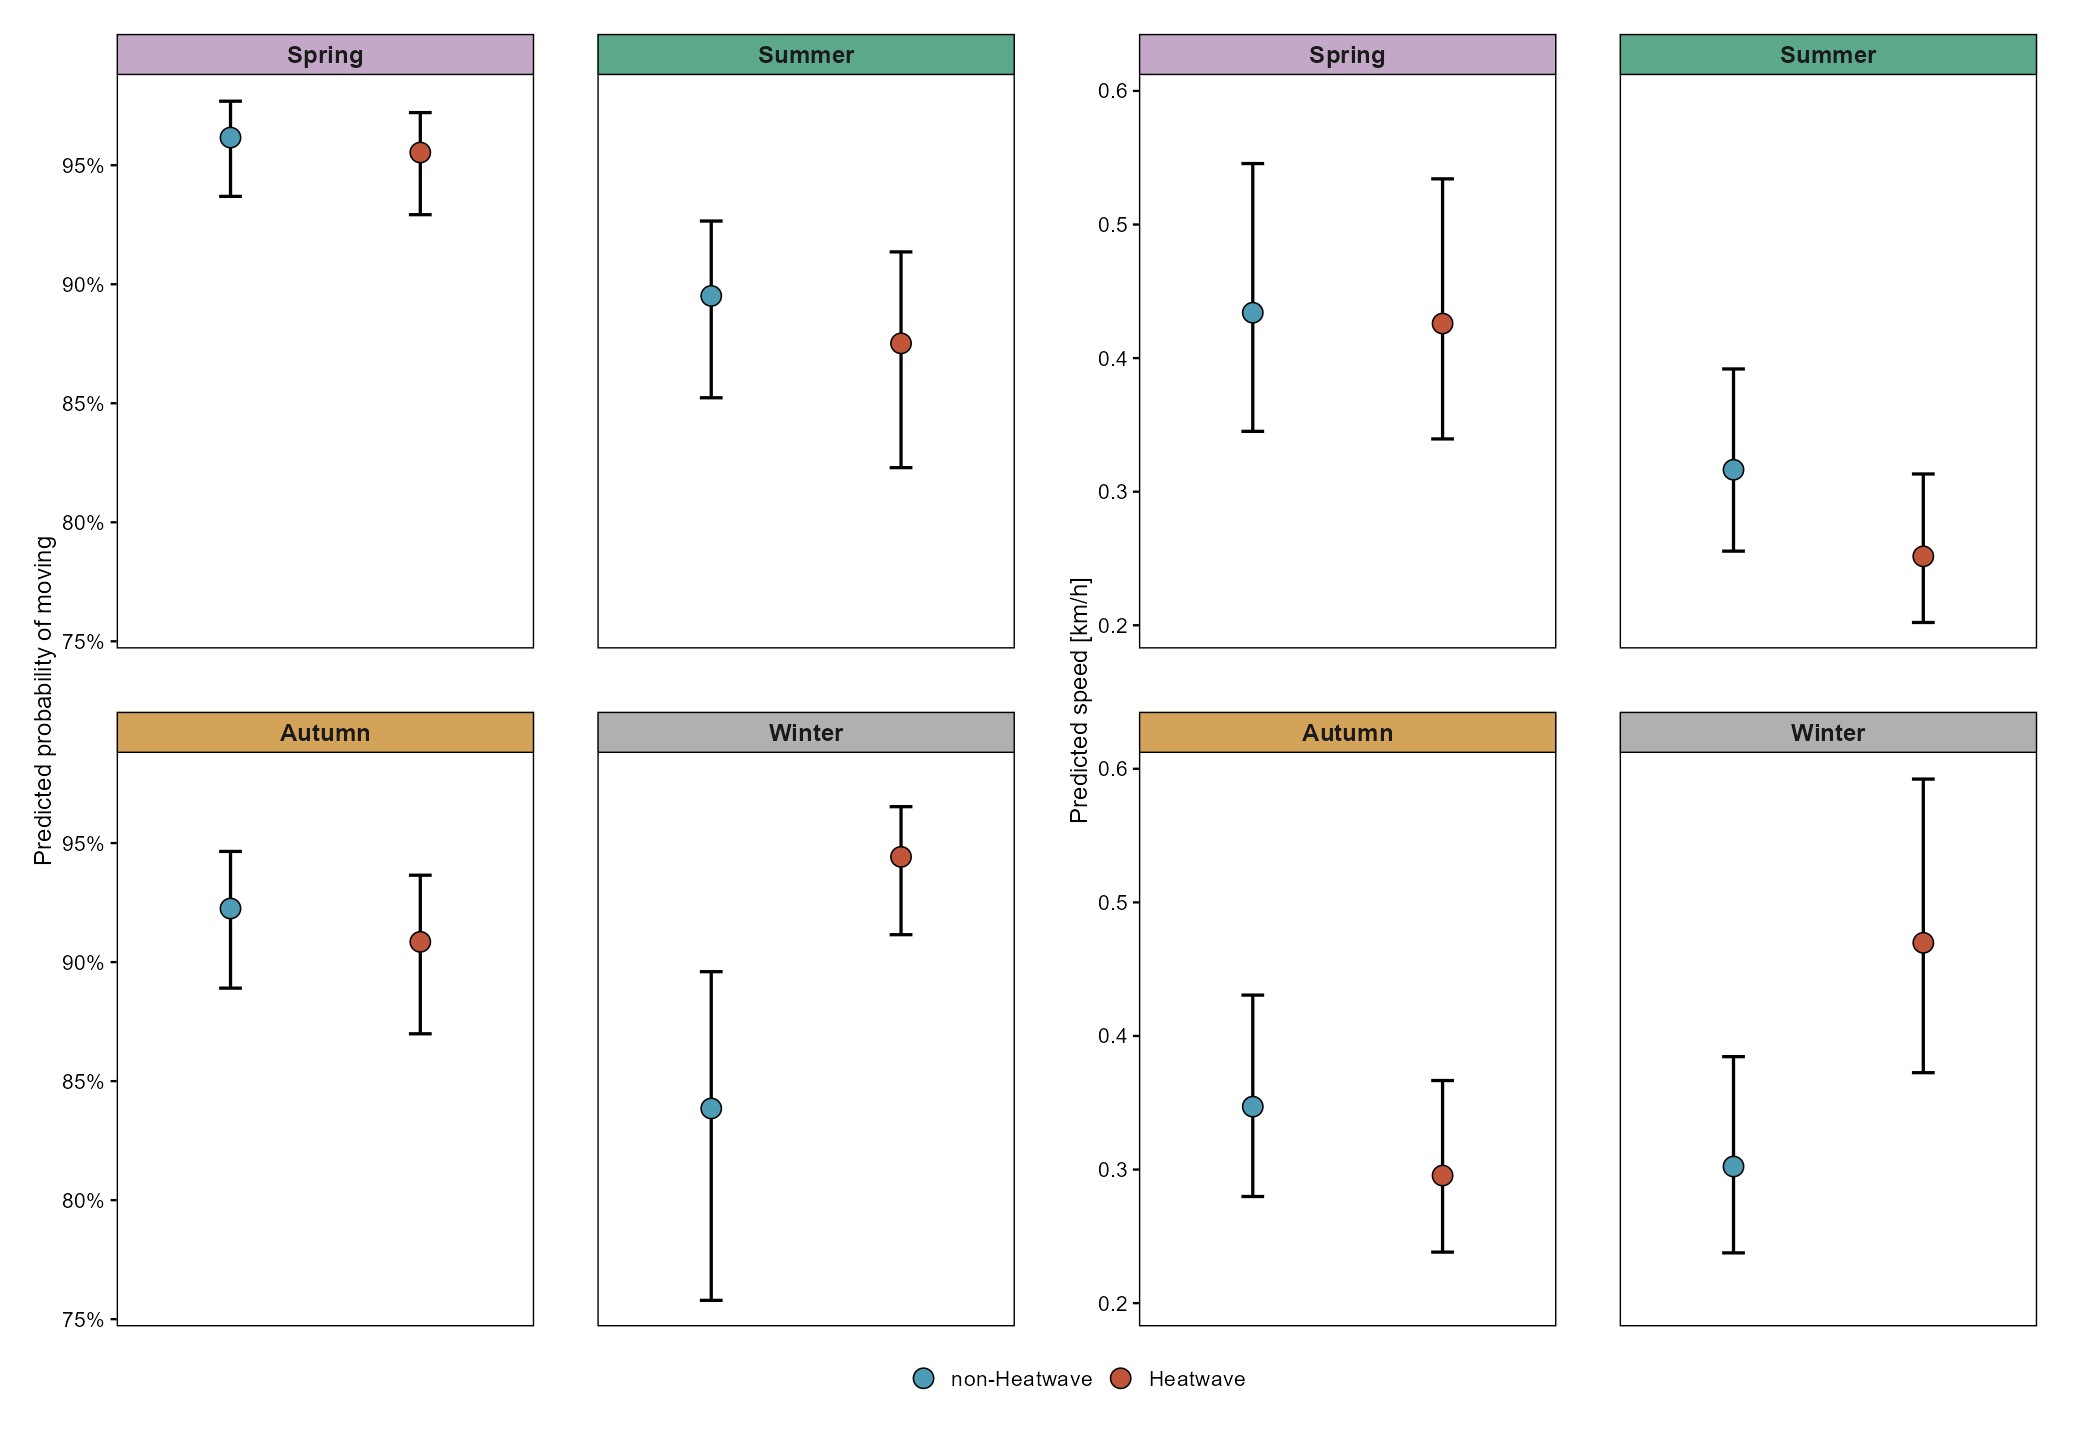
并结合 M-- 的回答,我相信这就是你想要的:等宽的面板边框。
完整代码
library(ggplot2)
library(patchwork)
library(ggh4x)

new_data_bin_hw <- structure(list(heatwave = c(0, 1, 0, 1, 0, 1, 0, 1), season2 = structure(c(1L, 1L, 2L, 2L, 3L, 3L, 4L, 4L), levels = c("Spring", "Summer", "Autumn", "Winter"), class = "factor"), TL = c(962L, 962L, 962L, 962L, 962L, 962L, 962L, 962L), lunar_day = c(16.6006576568519, 16.6006576568519, 16.6006576568519, 16.6006576568519, 16.6006576568519, 16.6006576568519, 16.6006576568519, 16.6006576568519), hour_of_day = c(12L, 12L, 12L, 12L, 12L, 12L, 12L, 12L), Transmitter = structure(c(1L, 1L, 1L, 1L, 1L, 1L, 1L, 1L), levels = c("Eel001", "Eel002", "Eel003", "Eel004", "Eel005", "Eel006", "Eel007", "Eel008", "Eel009", "Eel010", "Eel011", "Eel012", "Eel013", "Eel014", "Eel015", "Eel016", "Eel017", "Eel018", "Eel019", "Eel020", "Eel021", "Eel022", "Eel023", "Eel024", "Eel025", "Eel026", "Eel027", "Eel028", "Eel029", "Eel030", "Eel031", "Eel032", "Eel033", "Eel034", "Eel035", "Eel036", "Eel037", "Eel038", "Eel039", "Eel040", "Eel041", "Eel042", "Eel043", "Eel044", "Eel045", "Eel047", "Eel048", "Eel049", "Eel050", "Eel051", "Eel052", "Eel053", "Eel054", "Eel055", "Eel056", "Eel057", "Eel058", "Eel059", "Eel060", "Eel061", "Eel062", "Eel063", "Eel064", "Eel065", "Eel066", "Eel067", "Eel068", "Eel069", "Eel070", "Eel071", "Eel072", "Eel073", "Eel074", "Eel075", "Eel076", "Eel077", "Eel078", "Eel079", "Eel080", "Eel081", "Eel082", "Eel083", "Eel084", "Eel085", "Eel086", "Eel087", "Eel088", "Eel089", "Eel090", "Eel091", "Eel093", "Eel094", "Eel095", "Eel096", "Eel097", "Eel098", "Eel099", "Eel100", "Eel101", "Eel103", "Eel104", "Eel105", "Eel106", "Eel107", "Eel108", "Eel109", "Eel110", "Eel111", "Eel112", "Eel113", "Eel114", "Eel115", "Eel116", "Eel117", "Eel118", "Eel119", "Eel120", "Eel121", "Eel122", "Eel123", "Eel124", "Eel125", "Eel126", "Eel127", "Eel128", "Eel129", "Eel130", "Eel131", "Eel132", "Eel133", "Eel134", "Eel135", "Eel136", "Eel137", "Eel138", "Eel139", "Eel140", "Eel141", "Eel142", "Eel143", "Eel144", "Eel145", "Eel146", "Eel147", "Eel148", "Eel149", "Eel150", "Eel151", "Eel152", "Eel153", "Eel154", "Eel155", "Eel156", "Eel157", "Eel158", "Eel159", "Eel160", "Eel161", "Eel162", "Eel163", "Eel164", "Eel165", "Eel166", "Eel167", "Eel168", "Eel169", "Eel170", "Eel171", "Eel172", "Eel173", "Eel175", "Eel176", "Eel177", "Eel178", "Eel179", "Eel180", "Eel181", "Eel182", "Eel183", "Eel184", "Eel185"), class = "factor"), heatwave_event = structure(c(1L, 1L, 1L, 1L, 1L, 1L, 1L, 1L), levels = c("1", "2", "3", "4", "5", "6", "7", "8", "9", "10", "11"), class = "factor"), heatwave_label = structure(c(1L, 2L, 1L, 2L, 1L, 2L, 1L, 2L), levels = c("non-Heatwave", "Heatwave" ), class = "factor"), pred_prob = c(`1` = 0.961627566209907, `2` = 0.955343989430363, `3` = 0.895096723090536, `4` = 0.875158203607029, `5` = 0.922523984492865, `6` = 0.908513887249218, `7` = 0.83852609394597, `8` = 0.944225811707875), upper_ci = c(`1` = 0.976898968982644, `2` = 0.972112073891751, `3` = 0.926556518537287, `4` = 0.913589226768604, `5` = 0.946498411959461, `6` = 0.936510907213453, `7` = 0.895983946257647, `8` = 0.965301792855708), lower_ci = c(`1` = 0.936912651685311, `2` = 0.92922781378224, `3` = 0.852309035256633, `4` = 0.822947490839364, `5` = 0.889065598367977, `6` = 0.869886197874142, `7` = 0.757904854009687, `8` = 0.911521495666282)), row.names = c(NA, -8L), out.attrs = list( dim = c(heatwave = 2L, season2 = 4L), dimnames = list(heatwave = c("heatwave=0", "heatwave=1"), season2 = c("season2=Spring", "season2=Summer", "season2=Autumn", "season2=Winter"))), class = "data.frame")
new_data_spd_hw <- structure(list(heatwave = c(0, 1, 0, 1, 0, 1, 0, 1), season2 = structure(c(1L, 1L, 2L, 2L, 3L, 3L, 4L, 4L), levels = c("Spring", "Summer", "Autumn", "Winter"), class = "factor"), TL = c(962, 962, 962, 962, 962, 962, 962, 962), lunar_day = c(16.7230106290296, 16.7230106290296, 16.7230106290296, 16.7230106290296, 16.7230106290296, 16.7230106290296, 16.7230106290296, 16.7230106290296), hour_of_day = c(12, 12, 12, 12, 12, 12, 12, 12), Transmitter = structure(c(1L, 1L, 1L, 1L, 1L, 1L, 1L, 1L), levels = c("Eel001", "Eel002", "Eel003", "Eel004", "Eel005", "Eel006", "Eel007", "Eel008", "Eel009", "Eel010", "Eel011", "Eel012", "Eel013", "Eel014", "Eel015", "Eel016", "Eel017", "Eel018", "Eel019", "Eel020", "Eel021", "Eel022", "Eel023", "Eel024", "Eel025", "Eel026", "Eel027", "Eel028", "Eel029", "Eel030", "Eel031", "Eel032", "Eel033", "Eel034", "Eel035", "Eel036", "Eel037", "Eel038", "Eel039", "Eel040", "Eel041", "Eel042", "Eel043", "Eel044", "Eel045", "Eel047", "Eel048", "Eel049", "Eel050", "Eel051", "Eel052", "Eel053", "Eel054", "Eel055", "Eel056", "Eel057", "Eel058", "Eel059", "Eel060", "Eel061", "Eel062", "Eel063", "Eel064", "Eel065", "Eel066", "Eel067", "Eel068", "Eel069", "Eel070", "Eel071", "Eel072", "Eel073", "Eel074", "Eel075", "Eel076", "Eel077", "Eel078", "Eel079", "Eel080", "Eel081", "Eel082", "Eel083", "Eel084", "Eel085", "Eel086", "Eel087", "Eel088", "Eel089", "Eel090", "Eel091", "Eel093", "Eel094", "Eel095", "Eel096", "Eel097", "Eel098", "Eel099", "Eel100", "Eel101", "Eel103", "Eel104", "Eel105", "Eel106", "Eel107", "Eel108", "Eel109", "Eel110", "Eel111", "Eel112", "Eel113", "Eel114", "Eel115", "Eel116", "Eel117", "Eel118", "Eel119", "Eel120", "Eel121", "Eel122", "Eel123", "Eel124", "Eel125", "Eel126", "Eel127", "Eel128", "Eel129", "Eel130", "Eel131", "Eel132", "Eel133", "Eel134", "Eel135", "Eel136", "Eel137", "Eel138", "Eel139", "Eel140", "Eel141", "Eel142", "Eel143", "Eel144", "Eel145", "Eel146", "Eel147", "Eel148", "Eel149", "Eel150", "Eel151", "Eel152", "Eel153", "Eel154", "Eel155", "Eel156", "Eel157", "Eel158", "Eel159", "Eel160", "Eel161", "Eel162", "Eel163", "Eel164", "Eel165", "Eel166", "Eel167", "Eel168", "Eel169", "Eel170", "Eel171", "Eel172", "Eel173", "Eel175", "Eel176", "Eel177", "Eel178", "Eel179", "Eel180", "Eel181", "Eel182", "Eel183", "Eel184", "Eel185"), class = "factor"), heatwave_event = structure(c(1L, 1L, 1L, 1L, 1L, 1L, 1L, 1L), levels = c("1", "2", "3", "4", "5", "6", "7", "8", "9", "10", "11"), class = "factor"), heatwave_label = structure(c(1L, 2L, 1L, 2L, 1L, 2L, 1L, 2L), levels = c("non-Heatwave", "Heatwave" ), class = "factor"), pred_speed = c(`1` = 0.433979026375634, `2` = 0.425854058367608, `3` = 0.316427469907362, `4` = 0.25160964244507, `5` = 0.347116035661599, `6` = 0.295523694490404, `7` = 0.302274987911656, `8` = 0.469728040899192), upper_ci = c(`1` = 0.545633690815147, `2` = 0.534183412879381, `3` = 0.391883374763613, `4` = 0.313262729435615, `5` = 0.430589714483951, `6` = 0.366638720641387, `7` = 0.38450890314219, `8` = 0.592307134876665), lower_ci = c(`1` = 0.345172591986718, `2` = 0.339493280127572, `3` = 0.255500360974413, `4` = 0.20209046982829, `5` = 0.279824478292121, `6` = 0.238202484048813, `7` = 0.237628225433323, `8` = 0.372516924775754)), row.names = c(NA, -8L), out.attrs = list( dim = c(heatwave = 2L, season2 = 4L), dimnames = list(heatwave = c("heatwave=0", "heatwave=1"), season2 = c("season2=Spring", "season2=Summer", "season2=Autumn", "season2=Winter"))), class = "data.frame")


season_colours <- c(
  "Spring" = "#C3A8C7",   # dusty lilac
  "Summer" = "#5BA88A",   # muted teal-green
  "Autumn" = "#D4A35A",   # warm ochre
  "Winter" = "#B0B0B0"    # neutral grey
)


# Shared clean theme
hw_theme <- theme_classic() +
  theme(
    plot.title       = element_text(face = "bold", hjust = 0.5, size = 13),
    strip.text       = element_text(face = "bold", size = 11),
    strip.background = element_rect(colour = "black", linewidth = 0.6, fill = NA),
    axis.title       = element_text(size = 11),
    axis.text        = element_text(size = 10, colour = "black"),
    axis.text.x      = element_blank(),
    axis.ticks.x     = element_blank(),
    axis.line        = element_blank(), # as M-- proposed
    panel.border     = element_blank(),
    panel.spacing    = unit(2, "lines"),
    legend.position  = "bottom",
    legend.title     = element_blank(),
    legend.text      = element_text(size = 10),
    legend.key.size  = unit(1, "lines"),
    plot.margin      = margin(10, 15, 10, 10)
  )

# Heatwave point/fill colours
hw_colours <- c(
  "non-Heatwave" = "#4E9BB5",
  "Heatwave"     = "#C1553A"
)

# Strip fills matched to season factor levels
strip_fills <- strip_themed(
  background_x = elem_list_rect(
    fill = season_colours[levels(new_data_bin_hw$season2)]
    # NAs and NULLs will be silently dropped! You already gave colour and linewidth in "hw_theme"-> strip.background
  )
)

# |_| polygon that replaces the panel-border
u_panel <- annotate("path", x = c(-Inf, -Inf, Inf, Inf), y = c(Inf, -Inf, -Inf, Inf), linewidth = 0.6)

fig_HW_bin_seasonal <- ggplot(new_data_bin_hw,
                              aes(x = heatwave_label, y = pred_prob,
                                  fill = heatwave_label)) +
  geom_errorbar(
    aes(ymin = lower_ci, ymax = upper_ci),
    width = 0.12, linewidth = 0.7, colour = "black"
  ) +
  geom_point(size = 4, shape = 21, colour = "black") +
  u_panel +
  facet_wrap2(~ season2, nrow = 2, strip = strip_fills) +
  scale_fill_manual(values = hw_colours) +
  scale_y_continuous(labels = scales::percent_format(accuracy = 1)) +
  labs(x = NULL, y = "Predicted probability of moving") +
  hw_theme

fig_HW_spd_seasonal <- ggplot(new_data_spd_hw,
                              aes(x = heatwave_label, y = pred_speed,
                                  fill = heatwave_label)) +
  geom_errorbar(
    aes(ymin = lower_ci, ymax = upper_ci),
    width = 0.12, linewidth = 0.7, colour = "black"
  ) +
  geom_point(size = 4, shape = 21, colour = "black") +
  u_panel +
  facet_wrap2(~ season2, nrow = 2, strip = strip_fills) +
  scale_fill_manual(values = hw_colours) +
  labs(x = NULL, y = "Predicted speed [km/h]") +
  hw_theme

fig_HW_bin_seasonal + fig_HW_spd_seasonal +
  plot_layout(ncol = 2, guides = "collect") &
  theme(legend.position = "bottom")
得到
站内所有文章版权归属LeftHeroAI导航站,无授权禁止任何主体转载、抄袭、复制内容,亦不得私自架设镜像站点。一经侵权,本站将通过法律途径追责。
相关文章






汇集全球数千款 AI 工具,每日持续更新,配套 AI 开发学习资源,轻松用 AI 提升工作效率。快捷键 Ctrl+D/⌘+D 一键收藏本站。