


如何在地图上绘制带颜色的点位并添加图例?
我想用颜色来绘制位置点。位置点来自不同年份,这也是为什么我要用颜色来区分。下面是数据和代码。
library(terra)
library(tidyverse)
library(tidyterra)
library(tmap)
library(tmaptools)
library(ggspatial)

# Polygon
tvec <- matrix(c(-85,35,-85,45,-69,45,-69,35,-85,35),ncol = 2, byrow =T)
testvec <- as.polygons(vect(ext(tvec), crs = "epsg:4326"))

# Locations
y21 <- structure(list(Year = c("2021", "2021"), color = c("#FDE725FF",
"#FDE725FF"), x = c(-8261500, -8653500), y = c(5584500, 5195500
)), row.names = 1:2, class = "data.frame")

y22 <-
structure(list(Year = c("2022", "2022", "2022"), color = c("#21908CFF",
"#21908CFF", "#21908CFF"), x = c(-76.8643472856868, -80.2150632954527,
-77.6368984300296), y = c(42.7335303397623, 41.291949570207,
38.7330143191526)), row.names = c(NA, 3L), class = "data.frame")

loc21 <- vect(y21, geom = c("x","y"), crs = "epsg:4326")
loc22 <- vect(y22, geom = c("x","y"), crs = "epsg:4326")

# ggplot and tidyterra
ggplot() + geom_spatvector(data=testvec, col = "grey40") +
  geom_spatvector(data = loc22, col = "#21908CFF", show.legend = T) +
  geom_spatvector(data = loc21, col = "#FDE725FF", show.legend = T) +
  scale_color_manual(values = c("#FDE725FF","#21908CFF","black"), labels =
                       c("2021","2022","2023")) + theme_void()
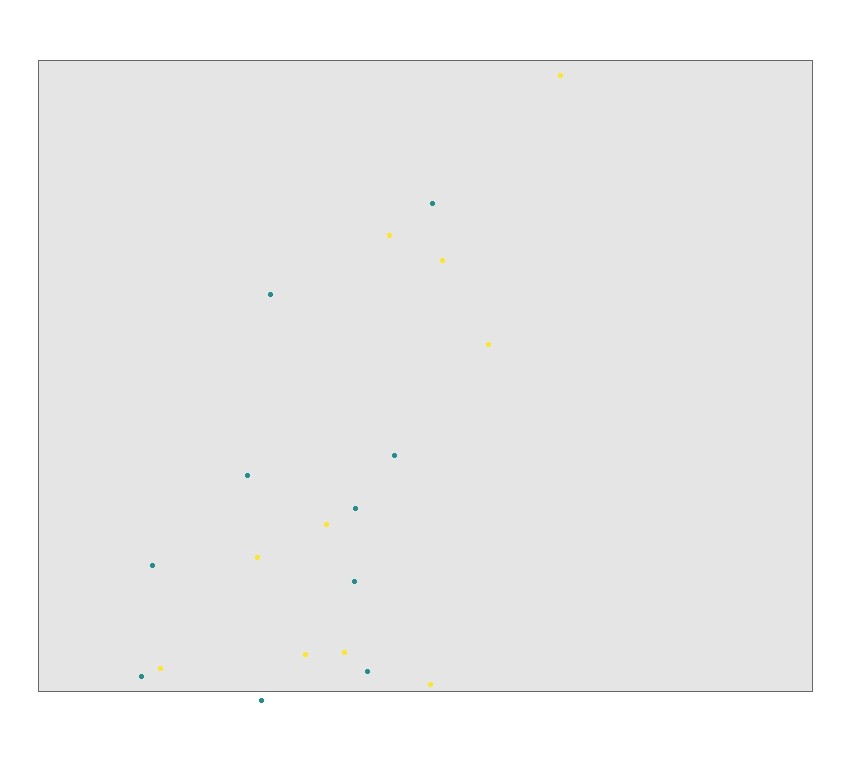
我能得到颜色,但没有图例。附上的图片中有更多的位置点,因为我为了简洁起见提供了数据的一个子集。
使用 tmap
tm_shape(testvec) + tm_polygons(fill = "grey60") +
  tm_shape(loc22) + tm_dots(col = "#21908CFF") + tm_shape(loc21) +
  tm_dots(col = "#FDE725FF") +
  tm_add_legend(labels = c("2021","2022"), col = c("#FDE725FF",
  "#21908CFF"), type = "dots")
这仍然无法为颜色提供点的颜色。我不知道图例是否会与颜色匹配。我觉得我对上面的代码做过修改,虽然字段上显示了颜色,但图例中没有。我现在不记得自己做了什么,我已经对这两个包进行了多次尝试。
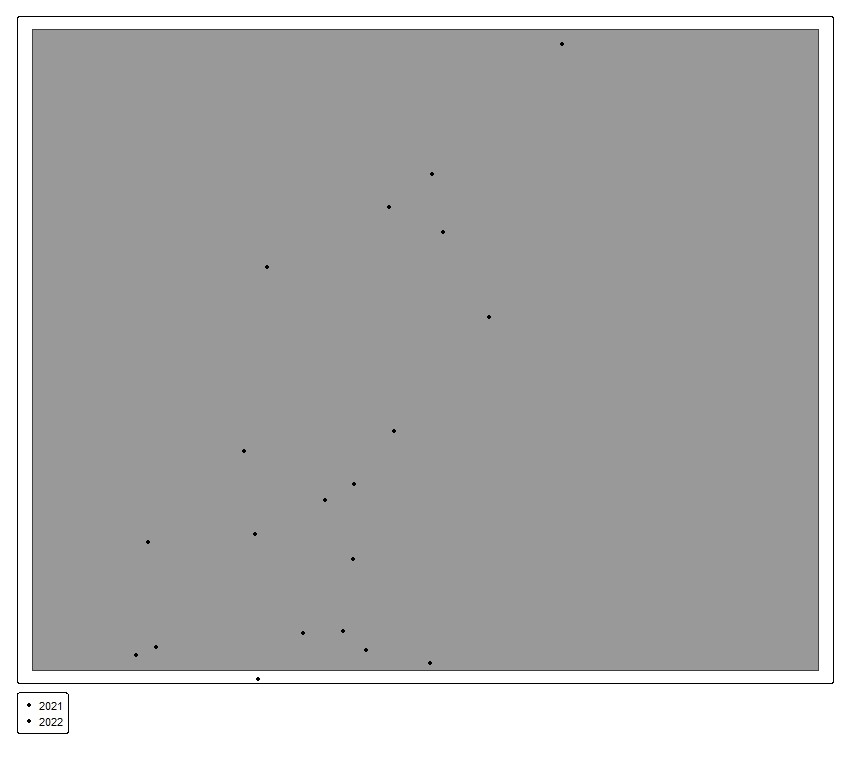
完整的绘图应在场景上有颜色,图例中的颜色也应与场景中的颜色相匹配,希望能够正确地反映年份。我尝试了一个变体,类似这里的答案:如何在地图上用不同颜色和图例绘制地理点?
allocs <- vect(rbind(y21,y22), geom = c("x","y"), crs = "epsg:4326")
# Optionally trying as factor for color or Year. Either way, they don't provide results
# I'm looking for.
#allocs$Year <- as.factor(allocs$Year)

tm_shape(testvect) + tm_polygons(fill = "grey60") + tm_shape(allocs) + tm_dots(col = "color")
这仍然无法为每个点分配不同的颜色(对应不同的年份)。
解决方案
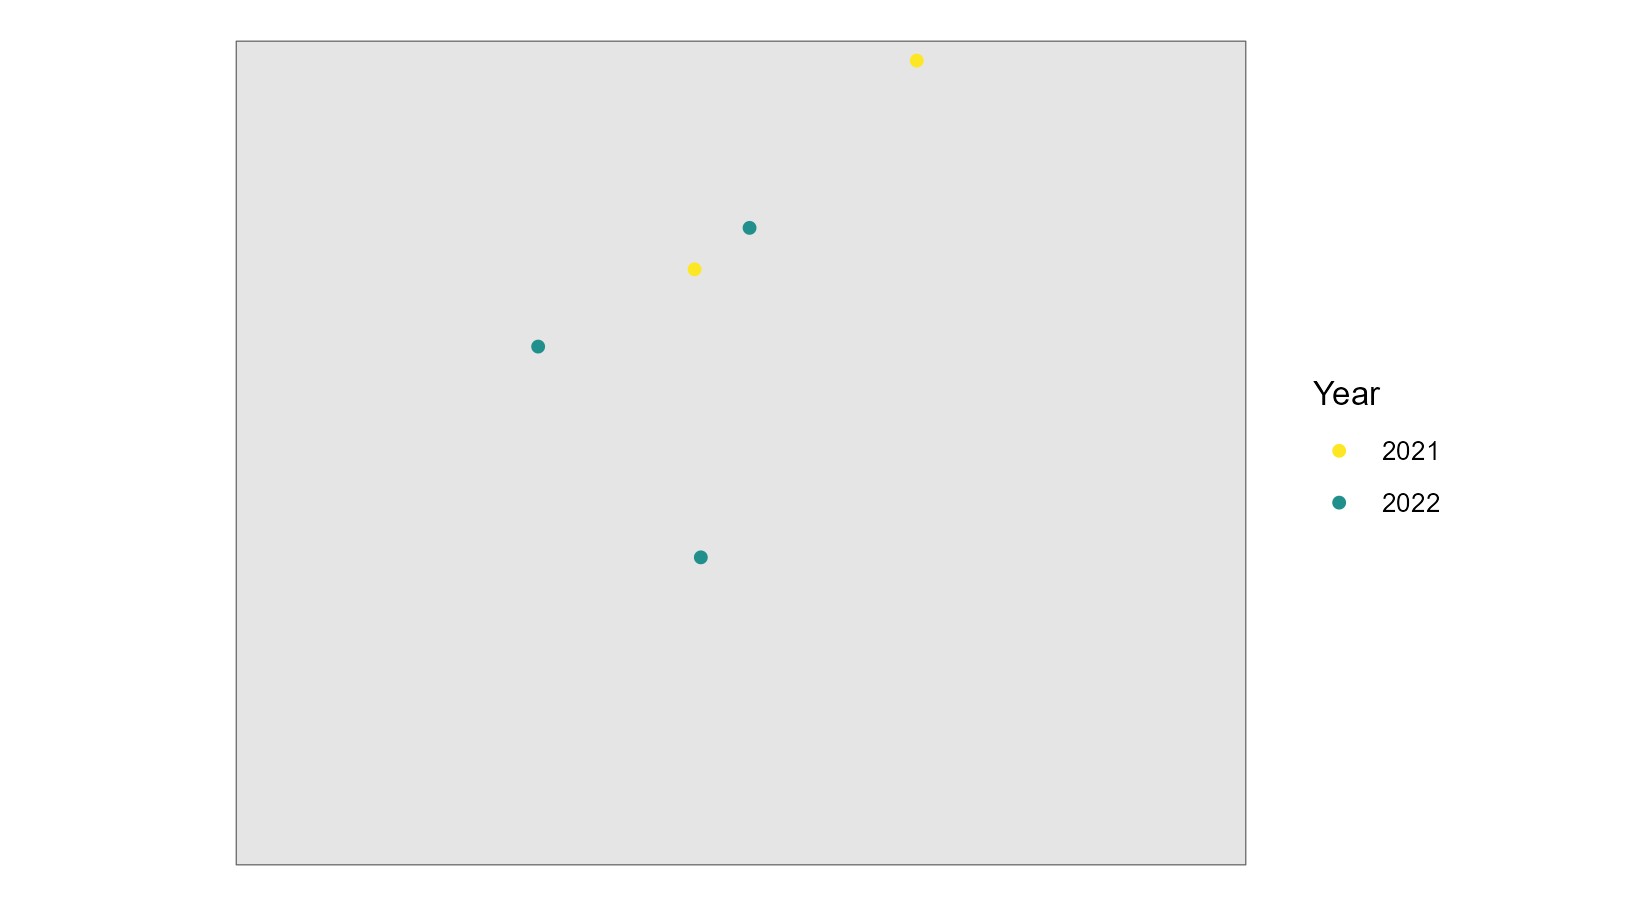
首先,你需要把 y21 投影到同一坐标系。然后将这两组数据绑定在一起,并在 aes() 中使用 Year:
loc21 <- vect(y21, geom = c("x", "y"), crs = "epsg:3857")
loc21 <- project(loc21, "epsg:4326")

loc22 <- vect(y22, geom = c("x", "y"), crs = "epsg:4326")

allocs <- rbind(loc21, loc22)

ggplot() +
  geom_spatvector(data = testvec, col = "grey40") +
  geom_spatvector(data = allocs, aes(col = Year)) +
  scale_color_manual(values = c("2021" = "#FDE725FF", "2022" = "#21908CFF")) +
  theme_void()
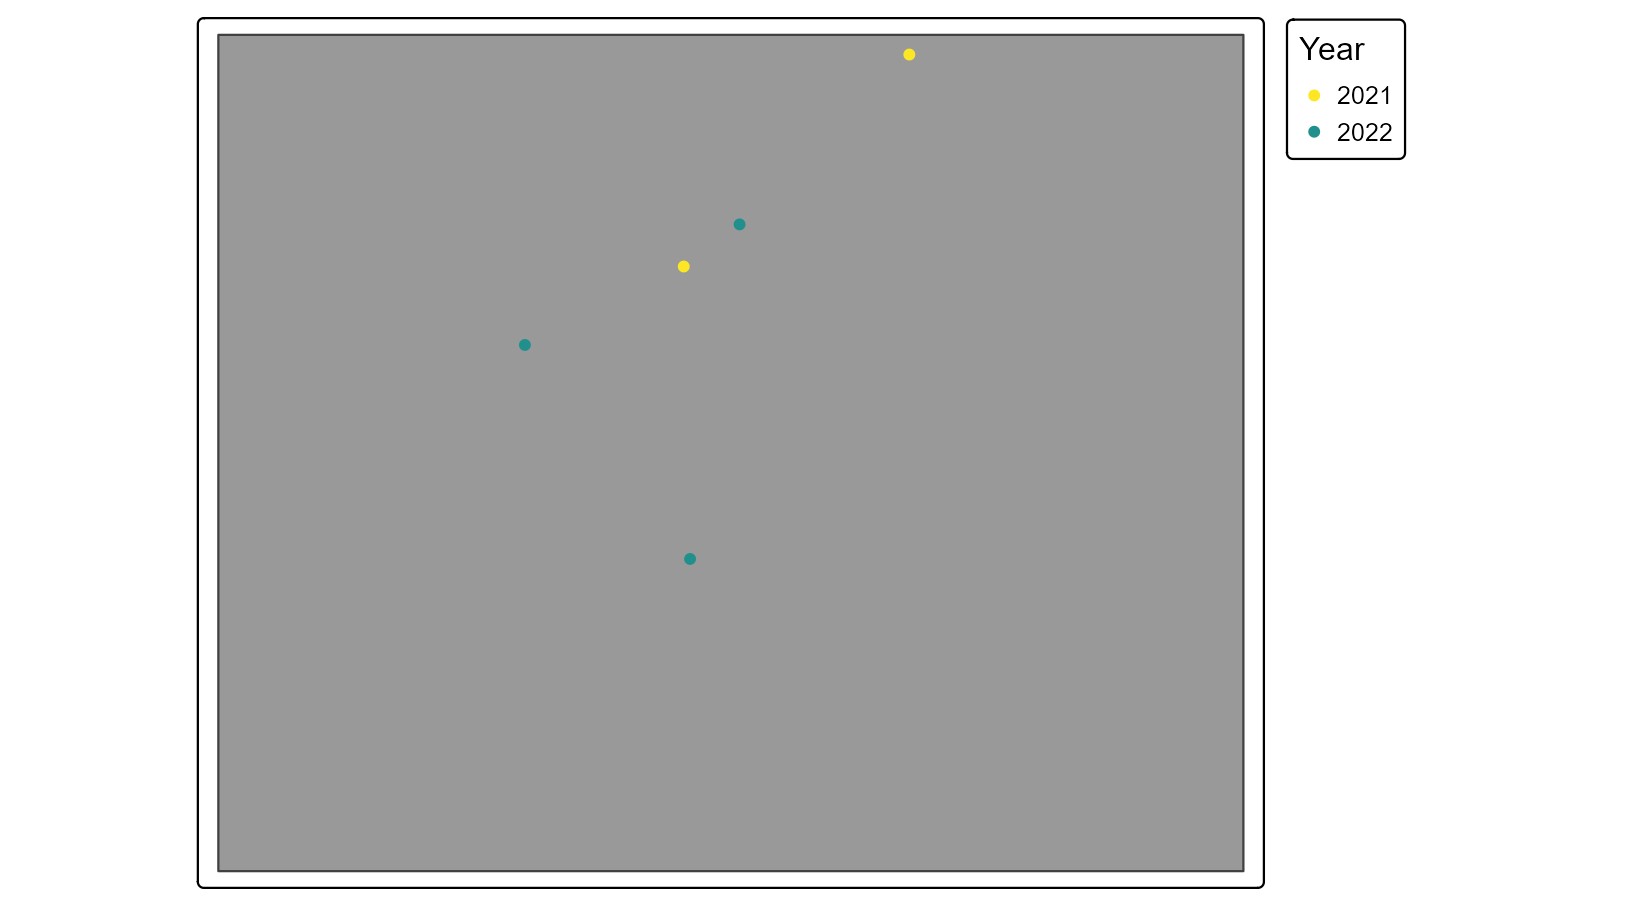
同样在 {tmap}:
tm_shape(testvec) + tm_polygons(fill = "grey60") +
  tm_shape(allocs) + tm_dots(fill = "Year",
    fill.scale = tm_scale_categorical(
      values = c("2021" = "#FDE725FF", "2022" = "#21908CFF")
    ))
创建于2026-02-24,使用 reprex v2.1.1
站内所有文章版权归属LeftHeroAI导航站,无授权禁止任何主体转载、抄袭、复制内容,亦不得私自架设镜像站点。一经侵权,本站将通过法律途径追责。
相关文章






汇集全球数千款 AI 工具,每日持续更新,配套 AI 开发学习资源,轻松用 AI 提升工作效率。快捷键 Ctrl+D/⌘+D 一键收藏本站。