


如何去除着色区域之间的间隙?
ggplot(taxo_diversity,aes(x=interval_Ma,y=species_richness))+
  geom_area(aes(fill=period,group=period),alpha=0.4)+
  geom_line(color="black",group=1)+
  theme_classic()+
  labs(x="Millions of years ago",y="Number of species")+
  scale_fill_manual(values=c("lightpink", "mediumpurple1", "skyblue", "darkolivegreen2","orange"))+
  theme(
    axis.text.x = element_text(angle=90,hjust=1,vjust=0.5),
    legend.position = "bottom"
  )
我的图表在不同时间段之间存在缺口,但我想把它们连接起来
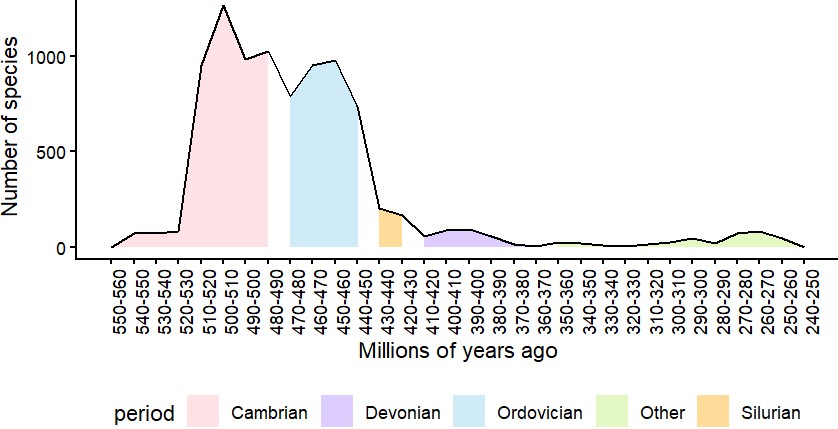
我的数据看起来大致如下
> taxo_diversity
# A tibble: 32 × 6
   interval_Ma species_richness start   end midpoint period
   <fct>                  <dbl> <dbl> <dbl>    <dbl> <chr>
 1 550-560                    0   550   560      555 Cambrian
 2 540-550                   72   540   550      545 Cambrian
 3 530-540                   72   530   540      535 Cambrian
 4 520-530                   84   520   530      525 Cambrian
 5 510-520                  950   510   520      515 Cambrian
 6 500-510                 1268   500   510      505 Cambrian
 7 490-500                  983   490   500      495 Cambrian
 8 480-490                 1023   480   490      485 Cambrian
 9 470-480                  790   470   480      475 Ordovician
10 460-470                  950   460   470      465 Ordovician
#22 more rows
解决方案
虽然我也喜欢其他回答,但如果你对边缘的颜色“混合”没有问题,我们可以简单地使用 geom_ribbon() 与 group = 1 来创建一个连续的区域。
library(ggplot2)

ggplot(taxo_diversity, aes(x = interval_Ma)) +
  geom_ribbon(aes(ymin = 0, ymax = species_richness,
                  fill = period, group = 1),
              alpha = 0.4) +
  geom_line(aes(y = species_richness),
            color = "black", group = 1) +
  labs(x = "Millions of years ago", y = "Number of species") +
  scale_fill_manual(values = c("lightpink", "mediumpurple1", "skyblue",
                               "darkolivegreen2", "orange")) +
  theme_classic() +
  theme(axis.text.x = element_text(angle = 90, hjust = 1, vjust = 0.5),
        legend.position = "bottom")
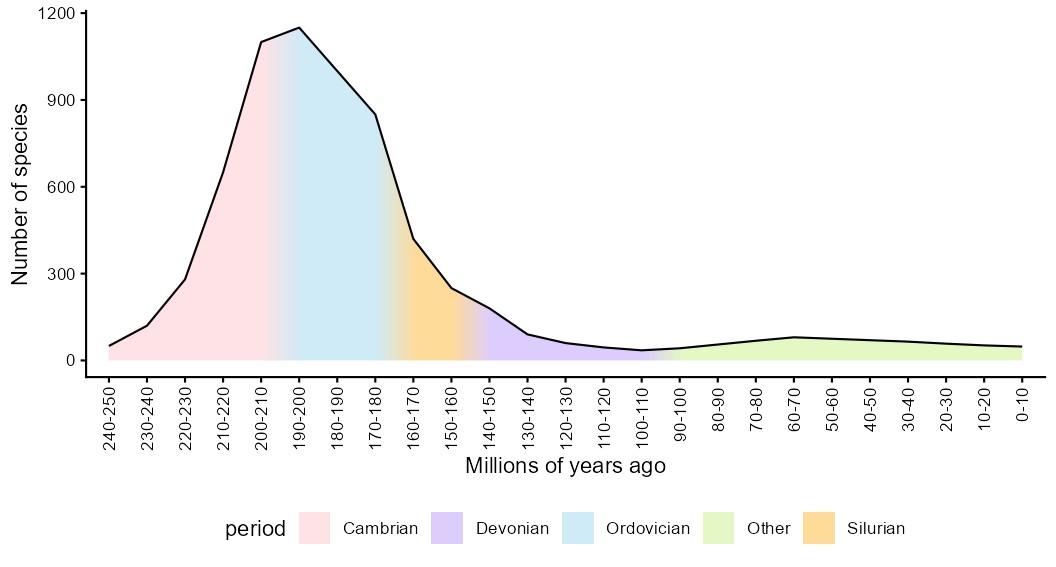
数据:
taxo_diversity <- structure(list(
  interval_Ma = structure(1:25, levels = c(
    "240-250", "230-240", "220-230", "210-220", "200-210",
    "190-200", "180-190", "170-180", "160-170", "150-160",
    "140-150", "130-140", "120-130", "110-120", "100-110",
    "90-100", "80-90", "70-80", "60-70", "50-60",
    "40-50", "30-40", "20-30", "10-20", "0-10"
  ), class = "factor"),
  species_richness = c(
    50L, 120L, 280L, 650L, 1100L,
    1150L, 1000L, 850L,
    420L, 250L,
    180L, 90L, 60L, 45L, 35L,
    42L, 55L, 68L, 80L, 75L,
    70L, 65L, 58L, 52L, 48L
  ),
  start = c(
    240L, 230L, 220L, 210L, 200L,
    190L, 180L, 170L,
    160L, 150L,
    140L, 130L, 120L, 110L, 100L,
    90L, 80L, 70L, 60L, 50L,
    40L, 30L, 20L, 10L, 0L
  ),
  end = c(
    250L, 240L, 230L, 220L, 210L,
    200L, 190L, 180L,
    170L, 160L,
    150L, 140L, 130L, 120L, 110L,
    100L, 90L, 80L, 70L, 60L,
    50L, 40L, 30L, 20L, 10L
  ),
  midpoint = c(
    245L, 235L, 225L, 215L, 205L,
    195L, 185L, 175L,
    165L, 155L,
    145L, 135L, 125L, 115L, 105L,
    95L, 85L, 75L, 65L, 55L,
    45L, 35L, 25L, 15L, 5L
  ),
  period = c(
    "Cambrian", "Cambrian", "Cambrian", "Cambrian", "Cambrian",
    "Ordovician", "Ordovician", "Ordovician",
    "Silurian", "Silurian",
    "Devonian", "Devonian", "Devonian", "Devonian", "Devonian",
    "Other", "Other", "Other", "Other", "Other",
    "Other", "Other", "Other", "Other", "Other"
  )
), row.names = as.character(1:25), class = "data.frame")
创建于2026-02-25,使用 reprex v2.1.1
站内所有文章版权归属LeftHeroAI导航站,无授权禁止任何主体转载、抄袭、复制内容,亦不得私自架设镜像站点。一经侵权,本站将通过法律途径追责。
相关文章






汇集全球数千款 AI 工具,每日持续更新,配套 AI 开发学习资源,轻松用 AI 提升工作效率。快捷键 Ctrl+D/⌘+D 一键收藏本站。