


如何在gnuplot中找到自动计算出的边距
在 gnuplot 中,是否有办法在屏幕坐标中确定自动计算出的边距,以便在另一张图中将它们固定下来?也就是说,如果 show margins 表示
    lmargin is computed automatically
    rmargin is computed automatically
    bmargin is computed automatically
    tmargin is computed automatically
在执行 plot 命令之后,是否有办法看到这些确定的边距?它是否取决于 terminal?对于 cairolatex 呢?
解决方案
在控制台输入 show var GPVAL_TERM,它会列出相关的gnuplot变量。也请查看 help margins。
请记住,GPVAL 变量只有在绘图命令执行后才会被设定。
为了把自动计算的边距传输到另一张图,你可以定义一个函数,它会返回屏幕坐标中的必要数值。之所以选用一个函数,是因为 GPVAL_ 的值是在调用该函数时取得的,因此你可以把任意数字作为函数的参数。
到目前为止我唯一不太理解的是,为什么
set margins at screen L(0),R(0),B(0),T(0)
没有按预期工作。因此,你必须通过 set lmargin ... 等逐一定义边距。
请查看下面使用 wxt 终端的示例。希望它也适用于其他终端。
脚本:
### take the computed margins from the previous plot
reset session
set term wxt size 640,480

set margins -1,-1,-1,-1    # auto margins

L(n) = GPVAL_TERM_XMIN/GPVAL_TERM_XSIZE*GPVAL_TERM_SCALE
R(n) = GPVAL_TERM_XMAX/GPVAL_TERM_XSIZE*GPVAL_TERM_SCALE
B(n) = GPVAL_TERM_YMIN/GPVAL_TERM_YSIZE*GPVAL_TERM_SCALE
T(n) = GPVAL_TERM_YMAX/GPVAL_TERM_YSIZE*GPVAL_TERM_SCALE

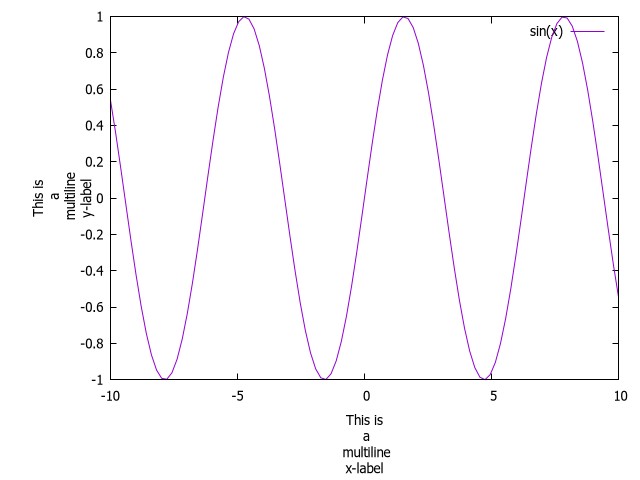
set xlabel "This is\n a\n multiline\nx-label"
set ylabel "This is\n a\n multiline\ny-label"
plot sin(x)

pause -1

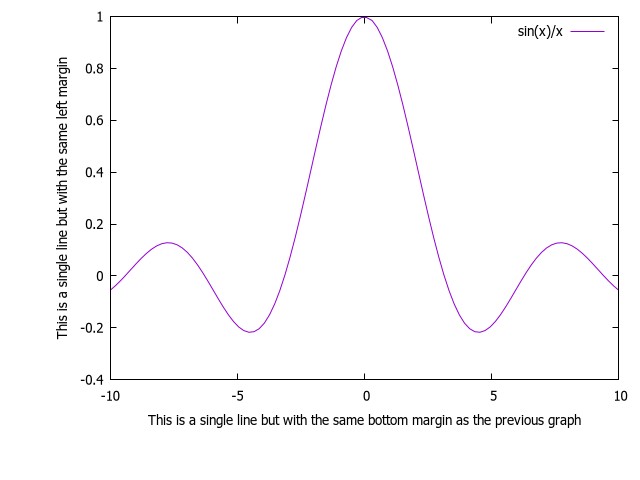
set xlabel "This is a single line but with the same bottom margin as the previous graph"
set ylabel "This is a single line but with the same left margin"
set lmargin at screen L(0)
set rmargin at screen R(0)
set bmargin at screen B(0)
set tmargin at screen T(0)

plot sin(x)/x
### end of script
结果:
站内所有文章版权归属LeftHeroAI导航站,无授权禁止任何主体转载、抄袭、复制内容,亦不得私自架设镜像站点。一经侵权,本站将通过法律途径追责。
相关文章






汇集全球数千款 AI 工具,每日持续更新,配套 AI 开发学习资源,轻松用 AI 提升工作效率。快捷键 Ctrl+D/⌘+D 一键收藏本站。