


如何修复这段Python代码,使其能够统计图像中不同长度的样本?
我正在努力回答这个问题:
How to fix this python code to count duplicate sample in the images?
使用 'rods_input.png' 作为输入:
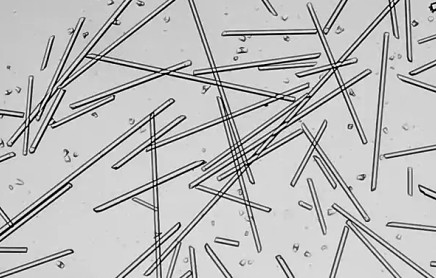
原帖的提问如下:
我想统计图像中的样本数量并像下图那样测量每个样本的长度。但是我遇到了一个很大的问题:当样本重叠时,无法得到准确的计数,例如实际样本数应该是2,但由于重叠,结果却变成4。我应该怎么做?或者有人能请帮忙修复我的代码吗?
我的代码如下,它会为每个图像处理步骤显示一张图片
import numpy as np
import cv2
# from cv2.ximgproc import thinning ### this one doesnt work skeleton more nthan one pixel wide  !!!!!!!!!!
from skimage.morphology import skeletonize
from skimage import img_as_ubyte
import imutils
print("Your OpenCV version: {}".format(cv2.__version__))
print("Are you using OpenCV 2.X? {}".format(imutils.is_cv2()))
print("Are you using OpenCV 3.X? {}".format(imutils.is_cv3()))
print("Are you using OpenCV 4.X? {}".format(imutils.is_cv4()))

### Load input image
image = cv2.imread('rods_input.png')
cv2.imshow("Input Image", image)
cv2.waitKey(0)
cv2.destroyAllWindows()

### How-to-add-border-around-an-image-in-opencv-python
###
###  https://stackoverflow.com/questions/36255654/how-to-add-border-around-an-image-in-opencv-python
####
row, col = image.shape[:2]
bottom = image[row-2:row, 0:col]
mean = cv2.mean(bottom)[0]
border_size = 10
image = cv2.copyMakeBorder(
    image,
    top=border_size,
    bottom=border_size,
    left=border_size,
    right=border_size,
    borderType=cv2.BORDER_CONSTANT,
    value=[mean, mean, mean]
)
cv2.imshow("Added border Image", image)
cv2.waitKey(0)
cv2.destroyAllWindows()

### Convert to grayscale
gray = cv2.cvtColor(image, cv2.COLOR_BGR2GRAY)
cv2.destroyAllWindows()
cv2.imshow("Gray Image", gray)
cv2.waitKey(0)
cv2.destroyAllWindows()

# Apply Gaussian blur to reduce noise
blur = cv2.GaussianBlur(gray, (13, 13), 0)      # Apply Gaussian blur to reduce noise
cv2.imshow("Blur Image", blur)
cv2.waitKey(0)
cv2.destroyAllWindows()

### Threshold blurred image
_, thresh_binary_inv = cv2.threshold(blur, 180, 255,  cv2.THRESH_BINARY_INV )
cv2.imshow("Treshold Image", thresh_binary_inv)
cv2.waitKey(0)
cv2.destroyAllWindows()

### clean small elements from threshold blurred image
num_labels, labels, stats, _ = cv2.connectedComponentsWithStats(thresh_binary_inv)
clean = np.zeros_like(thresh_binary_inv)
for i in range(1, num_labels):
    area = stats[i, cv2.CC_STAT_AREA]
    if area > 300:      # adjust experimentally
        clean[labels == i] = 255
cv2.imshow("Clean Image", clean)
cv2.waitKey(0)
cv2.destroyAllWindows()
cv2.imwrite('clean_to_be_skeletonized.jpg', clean)

### skeletonize threshold blurred cleaned image
### binary image
# skeleton = thinning(clean) ### this one doesnt work skeleton more nthan one pixel wide  !!!!!!!!!!
skeleton = skeletonize(clean)
skeleton = img_as_ubyte(skeleton)

print('skeletonized.png: image.dtype, image.shape :  ', skeleton.dtype , '  ',skeleton.shape, '   ', skeleton.ndim)
cv2.imshow(f"Skeletonized Image {skeleton.dtype} {skeleton.shape}", skeleton)
cv2.waitKey(0)
cv2.destroyAllWindows()
cv2.imwrite('skeletonized.png', skeleton)

### finding-intersections-of-a-skeletonised-image-in-python-opencv
### https://stackoverflow.com/questions/41705405/finding-intersections-of-a-skeletonised-image-in-python-opencv
def neighboursCoords(x,y,image):
    """Return 8-neighbours of image point P1(x,y), in a clockwise order"""
    img = image
    x_1, y_1, x1, y1 = x-1, y-1, x+1, y+1;
    return [ img[x_1][y], img[x_1][y1], img[x][y1], img[x1][y1], img[x1][y], img[x1][y_1], img[x][y_1], img[x_1][y_1] ]

def getSkeletonIntersection(skeleton):
    image = skeleton.copy();
    image = image/255;
    intersections = list();
    for y in range(1,len(image)-1):
        for x in range(1,len(image[y])-1):
            if image[y][x] == 1:
                # neighbourCount = 0;
                neighbours = neighboursCoords(y,x, image);
                if sum(neighbours) > 2:
                    print('--------------')
                    print(sum(neighbours) , y,x)
                    # print(neighbourCount,y,x);
                    intersections.append((y,x));
    return intersections;

## writes copy of imag with highlighted intersections
skeleton_coords_col = cv2.cvtColor(skeleton.copy(), cv2.COLOR_GRAY2RGB)
cv2.imshow('skeleton_coords_RGB', skeleton_coords_col)
cv2.waitKey(0)
for i in getSkeletonIntersection(skeleton):
        skeleton_coords_col[i] = [0,0,255]
cv2.imshow('skeleton_coords_RGB_intersections', skeleton_coords_col)
cv2.waitKey(0)
cv2.imwrite('skeleton_coords__RGB_intersections.png', skeleton_coords_col)

### writes black white image with deleted intersections
skeleton_coords_bn = skeleton.copy()
cv2.imshow('skeleton_coords', skeleton_coords_bn)
cv2.waitKey(0)
for i in getSkeletonIntersection(skeleton):
    skeleton_coords_bn[i] = 0
cv2.imshow('skeleton_coords_bn', skeleton_coords_bn)
cv2.waitKey(0)
cv2.imwrite('skeleton_coords_bn.png', skeleton_coords_bn)


## SECOND PART OF CODE USES cv2.connectedComponentsWithStats
## TO ISOLATE SINGLE FRAGMENTS

image = skeleton_coords_bn

print('skeleton_coords_bn.png: image.dtype, image.shape :  ', image.dtype , '  ',image.shape, '   ', image.ndim)

### Load original input image
image_ori = cv2.imread('rods_input.png')
print('rods_input.png: image.dtype, image.shape :  ', image_ori.dtype , '  ',image_ori.shape, '   ', image_ori.ndim)


# cv2.imshow("Image", image)
# cv2.waitKey(0)
cv2.destroyAllWindows()

# gray = cv2.cvtColor(image, cv2.COLOR_BGR2GRAY)  # Convert to grayscale

gray = image  # Convert to grayscale

print('gray.png: image.dtype, image.shape :  ', gray.dtype , '  ',gray.shape, '   ', gray.ndim)

_, thresh_binary = cv2.threshold(gray, 180, 255,  cv2.THRESH_BINARY)
cv2.imshow("Threshold Image", thresh_binary)
cv2.waitKey(0)
cv2.destroyAllWindows()

print('thresh_binary.png: image.dtype, image.shape :  ', thresh_binary.dtype , '  ',thresh_binary.shape, '   ', thresh_binary.ndim)

output = cv2.connectedComponentsWithStats(thresh_binary, 8, cv2.CV_16U)
(numLabels, labels, stats, centroids) = output

# print('numLabels, labels, stats, centroids : ', numLabels, labels, stats, centroids)
print('numLabels  : ', numLabels)
print('labels : ', labels)
print('stats : ', stats)
print('centroids : ', centroids)

print('numpy unique : ' , np.unique(labels))

# loop over the number of unique connected component labels
#for i in range(0, numLabels):  ## 0 is background
output = image_ori.copy()

for i in range(1, numLabels):
    # if this is the first component then we examine the
    # *background* (typically we would just ignore this
    # component in our loop)
    if i == 0:
        text = "examining component {}/{} (background)".format(i + 1, numLabels)
        # otherwise, we are examining an actual connected component
    else:
        text = "examining component {}/{}".format( i + 1, numLabels)
    # print a status message update for the current connected
    # component
    print("[INFO] {}".format(text))
    print("[INFO] {}".format(text)), print('   ', labels.shape, labels.ndim, )

    # extract the connected component statistics and centroid for
    # the current label
    x = stats[i, cv2.CC_STAT_LEFT]
    y = stats[i, cv2.CC_STAT_TOP]
    w = stats[i, cv2.CC_STAT_WIDTH]
    h = stats[i, cv2.CC_STAT_HEIGHT]
    area = stats[i, cv2.CC_STAT_AREA]
    (cX, cY) = centroids[i]

    # clone our original image (so we can draw on it) and then draw
    # bounding box surrounding the connected component along with
    #circle corresponding to the centroid

    cv2.rectangle(output, (x, y), (x + w, y + h), (0, 255, 0), 3)
    # cv2.circle(output, (int(cX), int(cY)), 4, (0, 0, 255), -1)
    cv2.putText(output, str(i) , (int(cX), int(cY)), cv2.FONT_HERSHEY_SIMPLEX, 0.5, (0, 0, 255), 2)

    # construct a mask for the current connected component by
    # finding a pixels in the labels array that have the current
    # connected component ID
    componentMask = (labels == i).astype("uint8") * 255
    # show our output image and connected component mask
    # cv2.imshow("Output", output)
    # cv2.imshow("Connected Component", componentMask)

    # cv2.imwrite('connected'+str(i)+'.png', componentMask)
    # cv2.waitKey(0)
    cv2.destroyAllWindows()

cv2.imshow("Output", output)
cv2.waitKey(0)

print('labels : ', labels.shape , labels.ndim, labels.dtype)

cv2.imwrite('labels.png', labels)

image_8bit = cv2.convertScaleAbs(labels)

print('image_8bit: ', image_8bit.shape , image_8bit.ndim, image_8bit.dtype)

image_8bit = cv2.convertScaleAbs(labels).astype('uint8')

cv2.imshow("image_8bit", image_8bit)
print('image_8bit: ', image_8bit.shape , image_8bit.ndim, image_8bit.dtype)
cv2.waitKey(0)

im_color = cv2.applyColorMap(image_8bit, cv2.COLORMAP_JET)
cv2.imshow("im_color ", im_color)
print('ima_color: ', im_color.shape , im_color.ndim, im_color.dtype)
cv2.waitKey(0)

# 2. Create a random lookup table (LUT)
# OpenCV 4.0 fails the code below need to use numpy directly
# Generate 256 random colors with 3 channels (BGR)
#np.random.seed(42)  # Seed for reproducible colors
# lut = np.random.randint(0, 256, size=(256, 3), dtype=np.uint8)
# lut = np.random.randint(0, 256, size=(256, 1,  3), dtype=np.uint8)  ### --> error
### error: OpenCV(4.2.0) ../modules/core/src/lut.cpp:366: error:
### (-215:Assertion failed) (lutcn == cn || lutcn == 1) && _lut.total() == 256 && _lut.isContinuous()
###  && (depth == CV_8U || depth == CV_8S) in function 'LUT'

np.random.seed(42)
lut = np.random.randint(0, 256, size=(256, 3), dtype=np.uint8)
# Optional: Force black (0) to remain black and white (255) to remain white
lut[0] = [0, 0, 0]

color_img = lut[image_8bit]

cv2.imshow("color_img", color_img)
print('color_img: ', color_img.shape , color_img.ndim, color_img.dtype)
cv2.waitKey(0)
cv2.imwrite('color_img.png', color_img)

##need to get colinear segments
######## trying CONVOLUTION
######## https://stackoverflow.com/questions/67143809/finding-the-end-points-of-a-hand-drawn-line-with-opencv
######## https://stackoverflow.com/questions/26537313/how-can-i-find-endpoints-of-binary-skeleton-image-in-opencv

# Set the end-points kernel:
# Source - https://stackoverflow.com/a/72368480
# Posted by Jeru Luke
# Retrieved 2026-06-06, License - CC BY-SA 4.0

h = np.array(([ 1, 1,  1],
              [ 1, 10,  1],
              [ 1, 1,  1]), dtype="int")

extremes_dict = dict()
for i in range(1, numLabels):
    print('numLabels : ', i)
    labels_copy = labels.copy()
    labels_copy[labels_copy != i] = 0
    labels_copy[labels_copy == i] = 255
    print('labels_copy: ', labels_copy.shape , labels_copy.ndim, labels_copy.dtype)

    # cv2.imshow("labels_copy", labels_copy.astype('uint8'))
    print("labels_copy.astype('uint8') : ", labels_copy.astype('uint8').shape , labels_copy.astype('uint8').ndim, labels_copy.astype('uint8').dtype)
    # cv2.waitKey(0)

    # # Convolve the image with the kernel h
    endpoints_only = cv2.filter2D(src=labels_copy.astype('uint8')/255, ddepth=-1, kernel=h)

    # cv2.imshow("endpoints_only", endpoints_only*255)
    # cv2.waitKey(0)
    # print('endpoints_only: ', endpoints_only.shape , endpoints_only.ndim, endpoints_only.dtype)

    print('endpoints_only: ', endpoints_only.shape , endpoints_only.ndim, endpoints_only.dtype)

    pnts = np.argwhere(endpoints_only == 11)
    print('pnts : ', pnts)
    extremes = pnts
    add = []
    for p in extremes:
        # print(i)
        cv2.circle(image_8bit, (p[1], p[0]), 5, 128)
        cv2.circle(color_img, (p[1], p[0]), 5, 128)
        add.append((p[1], p[0]))

    ### this fails if skeletonization leaves 1 pixel isolate
    #extremes_dict[i] = add

    # use
    if len(add) == 2:
        extremes_dict[i] = add

cv2.imshow("image_8bit", image_8bit)
print('image_8bit: ', image_8bit.shape , image_8bit.ndim, image_8bit.dtype)
cv2.waitKey(0)

cv2.imshow("color_img", color_img)
print('color_img : ', color_img.shape , color_img.ndim, color_img.dtype)
cv2.waitKey(0)
cv2.imwrite('color_img_endpoints.png', color_img)

for i in extremes_dict:
    print(i , extremes_dict[i])


# cv2.imshow('labels' , cv2.convertScaleAbs(labels))
# cv2.waitKey(0)
我的代码本质上卡在Christoph Rackwitz的注释上:
you could try to detect the crossing point and reassemble the "incident edges" by which ones are parallel ( + incident to the node = colinear). –
我可以对图像进行骨架化并找到交点及其端点:
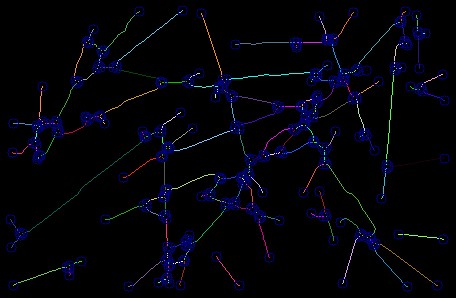
这里每条颜色不同的线(样本中交点像素被移除)通过其端点(蓝色圆圈)来标记。
与输入图像叠加:
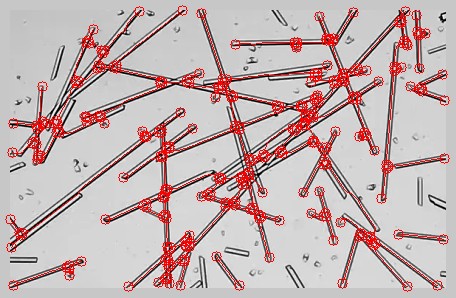
我需要找出在这张图里如何检索出共线的直线,或者更好地说,近似共线的直线(也就是落在同一条想象中的无限直线上并彼此接近)。
我需要处理 labels,也就是 output = cv2.connectedComponentsWithStats(thresh_binary, 8, cv2.CV_16U)
(numLabels, labels, stats, centroids) = output 的输出:一个数组,其中每条不同的直线由一个不同的 numLabels(一个灰度值)定义,当然我还得到 extremes_dict——一个字典,其中每个 numLabels 都与两端点坐标相关联。
我猜不同直线之间的间隙相当狭窄,我的代码只是删除了一个像素的交点,不确定阈值处理是否在交点以外的其他位置破坏了某些杆。
我的数学不是很好,几何也可能更糟。有什么想法来解决这个问题吗?我最担心的还是近似共线的定义。
解决方案
这不是一个完整的答案——更像是一个扩展注释,附带图片来说明我倾向于如何解决这个问题。这仅对看起来像你示例的图像有效。理论上可以在原始图像上完成,但如果你先对原图进行卷积,选取合适尺寸的圆盘(直径要能在每根杆的中线处形成一条干净的白线),处理起来可能更容易。
对圆盘进行卷积后的图像——杆现在呈现为实心、中间有一条细白线。通过对该特征进行拟合来描述每条线在节点之间的情况。你可能想使用稍小一点的圆盘——在SO上白线并不真正显现。
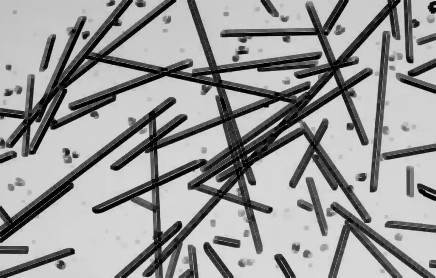
对每条线性特征使用相同的坐标系统(例如图像的一个角落作为原点)拟合最优拟合直线。然后你可以相对容易地判断一对线段是否确实在同一直线上。
使用贪心算法先把所有干净且彼此独立的杆取出,随后处理那些只有一个交点、两个交点等,直到用完所有线段。我已按算法在下方的四个跨点情况对骨架图像进行了颜色编码。
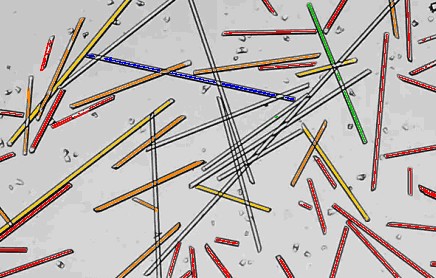
关键颜色:红色0 个节点,橙色1 个节点,黄色2 个节点,绿色3 个节点,蓝色4 个节点等等。
按检测到的交叉节点数量进行颜色编码,可以更容易地人工检查代码。如果一切都是红色,那么就会很混乱。
我注意到你的代码忽略了短杆,直径与长度的比值小于6:1,这是不是有意为之?这会严重改变你关于长度分布的统计。确实有不少这样的杆没有被检测到。
SO到目前为止:
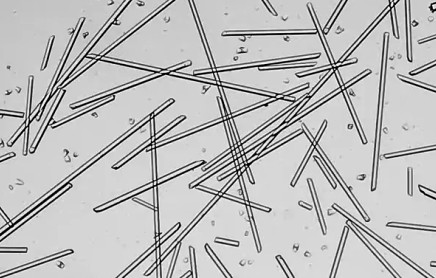
输入:rods_input.png:
以及代码:
import cv2
import numpy as np
import imutils
print("Your OpenCV version: {}".format(cv2.__version__))
print("Are you using OpenCV 2.X? {}".format(imutils.is_cv2()))
print("Are you using OpenCV 3.X? {}".format(imutils.is_cv3()))
print("Are you using OpenCV 4.X? {}".format(imutils.is_cv4()))

### Load input image
image = cv2.imread('rods_input.png')
cv2.imshow("Input Image", image)
cv2.waitKey(0)
cv2.destroyAllWindows()

print('image.shape ; ', image.shape)
image = cv2.cvtColor(image, cv2.COLOR_BGR2GRAY)
print('image.shape ; ', image.shape)

# invert image
image = cv2.bitwise_not(image)
cv2.imshow("Input Image _", image)
cv2.waitKey(0)
cv2.destroyAllWindows()

ret, thresh = cv2.threshold(image, 0, 255, cv2.THRESH_BINARY_INV + cv2.THRESH_OTSU)
image = thresh

cv2.imshow("Thresh Image", image)
cv2.waitKey(0)
cv2.destroyAllWindows()

# Create a disc (pillbox) kernel with a radius of, for example, 5 pixels
kernel_size = 5 # Must be an odd number
radius = 2

# Create a circular mask
y, x = np.ogrid[-radius:radius+1, -radius:radius+1]
mask = x*x + y*y <= radius*radius

# Create the kernel matrix
disc_kernel = np.zeros((kernel_size, kernel_size), dtype=np.float32)
disc_kernel[mask] = 1

# Normalize the kernel
disc_kernel /= np.sum(disc_kernel)   ####  x /= 3  equivalent to x = x / 3
print('disk kernel :\n ', disc_kernel)

# Apply to an image
blurred_image = cv2.filter2D(image, -1, disc_kernel)
cv2.imshow("Blurred Image", blurred_image)
cv2.imwrite('blurred_image.png', blurred_image)
cv2.waitKey(0)
cv2.destroyAllWindows()
我可以得到 blurred_image.png:
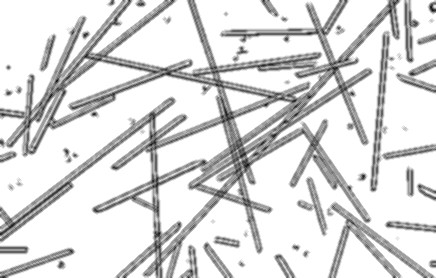
看起来像你发布的那个,使用:
kernel = cv2.getStructuringElement(cv2.MORPH_RECT, (3, 3))
tophat = cv2.morphologyEx(gray_img, cv2.MORPH_TOPHAT, kernel)
或者更好一些(与显微镜镜头应为圆形这一事实相关):
kernel = cv2.getStructuringElement(cv2.MORPH_ELLIPSE, (4, 4))
tophat = cv2.morphologyEx(gray_img, cv2.MORPH_TOPHAT, kernel)
我可以进一步得到:
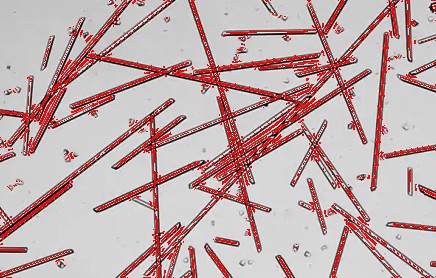
实际上我在不使用你上述代码中提出的模糊图像(通过圆盘卷积)时,得到了一张更好的图像,改用:
ret, thresh = cv2.threshold(image, 0, 255, cv2.THRESH_BINARY_INV + cv2.THRESH_OTSU)
在一张取反图像上(这让算法在寻找结构元素时更有效):
image = cv2.bitwise_not(image)
结果如下:
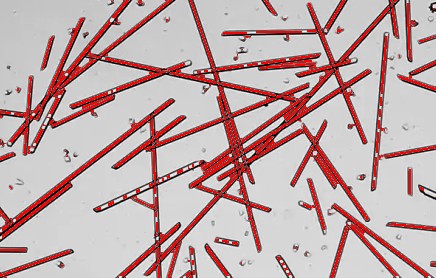
,但 cv2.morphologyEx 返回一个表示处理后图像的NumPy数组;
所以我又回到了起点,陷入
cv2.connectedComponentsWithStats
需要重新获取单独的 labels,再次回到原始问题。
我需要找出如何在这张图片中检索出共线的直线,或者更好地说,近似共线的直线(也就是落在同一条想象中的无限直线上并彼此靠近)。
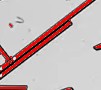
尽管这看起来比我第一轮尝试要好,在这里我可以把粘连的杆识别为两条样本:
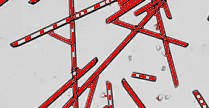
在这里我得到的线条更为碎裂:
别忘了,为了在第一轮尝试和第二轮中找到交点,我的线条需要通过 skeletonize 从 skimage.morphology 使宽度降到1 像素,这比我用 cv2.ximgproc.thinning 的尝试要好,除非我漏掉了一些 thinningType 参数,导致中心线仍然是1 像素厚。
需要弄清楚的是 cv2.houghLinesP 是否比以上方法更好。
相关文章





