


在信息量很大的RDA图中移除或优化标签
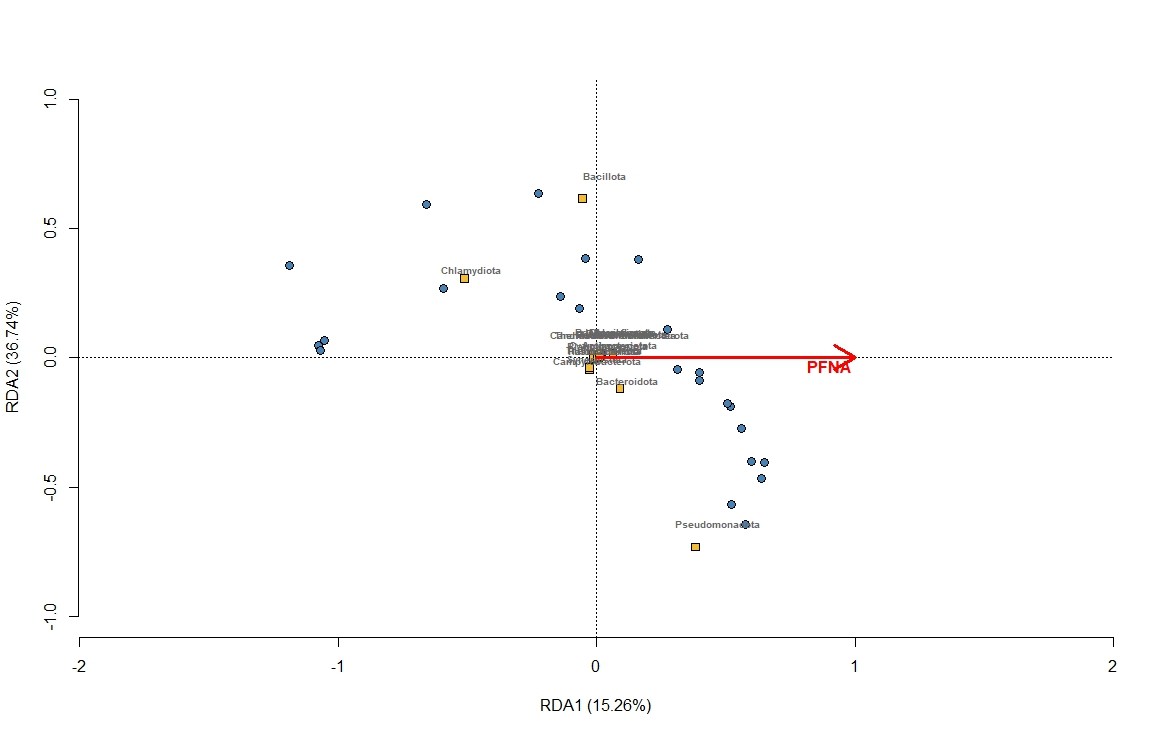
我正在使用Vegan和 ggplot来创建一个RDA图,但在处理点标签的混乱时遇到了困难。它们不易读,我尝试过只用少数字母的缩写,但并没有改善图形。是否可以从图中移除一些(重叠的)标签,调整间距以减少重叠?任何建议都会不胜感激!谢谢!
spe.rda.signif <- rda(phyla_hel ~ PFNA, data = pfas_sc)

## extract scores - these are coordinates in the RDA space
sc_si <- scores(spe.rda.signif, display="sites", choices=c(1,2), scaling=2)
sc_sp <- scores(spe.rda.signif, display="species", choices=c(1,2), scaling=2)
sc_bp <- scores(spe.rda.signif, display="bp", choices=c(1, 2), scaling=2)

plot(spe.rda.signif,
     scaling = 2, # set scaling type
     type = "none", # this excludes the plotting of any points from the results
     frame = FALSE,
     # set axis limits
     xlim = c(-1,1),
     ylim = c(-1,1),
     # label the plot (title, and axes)
     xlab = paste0("RDA1 (", perc[1], "%)"),
     ylab = paste0("RDA2 (", perc[2], "%)")
)
# add points for site scores
points(sc_si,
       pch = 21, # set shape (here, circle with a fill colour)
       col = "black", # outline colour
       bg = "steelblue", # fill colour
       cex = 1.2) # size
# add points for species scores
points(sc_sp,
       pch = 22, # set shape (here, square with a fill colour)
       col = "black",
       bg = "#f2bd33",
       cex = 1.2)
# add text labels for species abbreviations
text(sc_sp + c(0.03, 0.09), # adjust text coordinates to avoid overlap with points
     labels = rownames(sc_sp),
     col = "grey40",
     font = 2, # bold
     cex = 0.8)
# add arrows for effects of the expanatory variables
arrows(0,0, # start them from (0,0)
       sc_bp[,1], sc_bp[,2], # end them at the score value
       col = "red",
       lwd = 3)

# add text labels for arrows
text(x = sc_bp[,1] -0.1, # adjust text coordinate to avoid overlap with arrow tip
     y = sc_bp[,2] - 0.03,
     labels = rownames(sc_bp),
     col = "red",
     cex = 1,
     font = 2)
解决方案
在RDA图中避免混乱可能做不到。不过,在适度混乱的情况下,以下方法在当前vegan版本中可能奏效(CRAN现有版本为2.7-3):
plot(spe.rda.signif, spe.par = list(optimize=TRUE, type="t"),
     sit.par = list(type="p"))
或者你也可以使用管道(在当前vegan版本中也可用):
plot(spe.rda.signif, type = "n") |>
   points("sites", cex=0.7) |>
   text("species", col="red", cex=0.7, optimize=TRUE) |>
   text("biplot", col="blue")
如果你想使用ggplot2,我建议尝试ggvegan:
library(ggvegan) # ordiggplot, ggscores, geom_ordi_*
library(ggplot2)
library(ggrepel) # geom_*_repel
ordiggplot(spe.rda.signif) +
   geom_ordi_axis() +
   geom_ordi_point("sites") +
   geom_ordi_point("species", col="red") +
   geom_text_repel(data=ggscores("species"), col="red") +
   geom_ordi_arrow("biplot", col="blue")
站内所有文章版权归属LeftHeroAI导航站,无授权禁止任何主体转载、抄袭、复制内容,亦不得私自架设镜像站点。一经侵权,本站将通过法律途径追责。
相关文章






汇集全球数千款 AI 工具,每日持续更新,配套 AI 开发学习资源,轻松用 AI 提升工作效率。快捷键 Ctrl+D/⌘+D 一键收藏本站。