


在ggplot2中为连续变量的图例指定自定义断点
当图例是连续变量时,我需要在ggplot的图例数值中指定自定义断点。多亏了 这篇帖子,我可以看到如何在 scale_colour_distiller() 中使用 breaks 参数,但它把0 给省略了。
示例代码
ggplot(data = iris,
       mapping = aes(x = Sepal.Length,
                     y = Petal.Length,
                     colour = Petal.Width)) +
       geom_point() +
       scale_colour_distiller(palette = "Spectral",
                              breaks = c(0,1.0,2.0)) # note custom breaks
结果如下
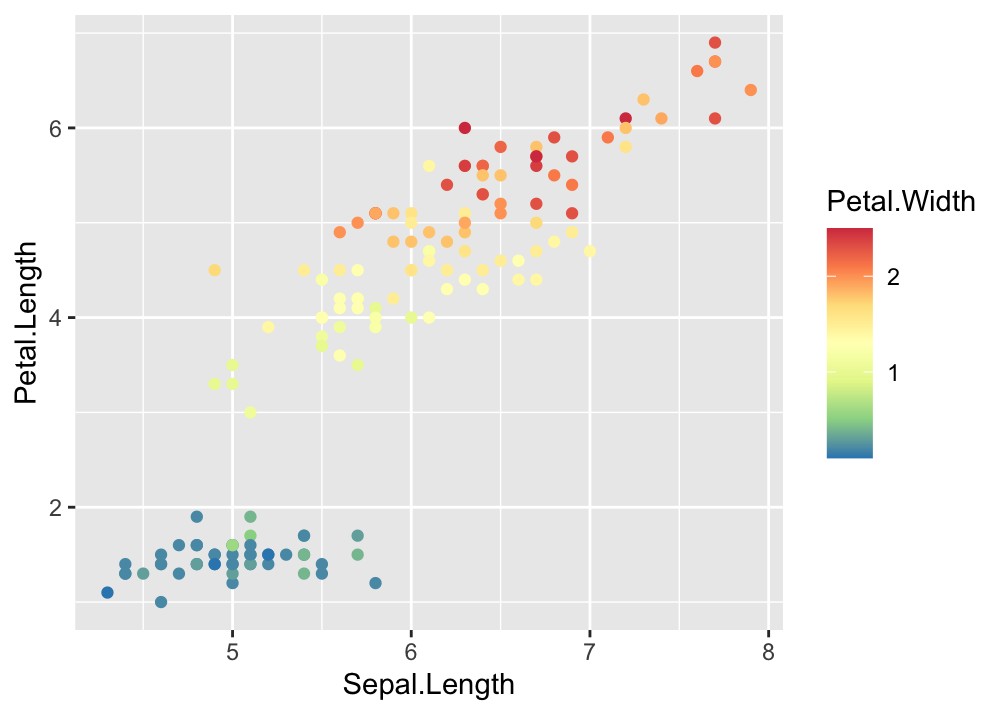
现在我该如何修改图例中的数值,使其既包含我自定义的断点,又包含0?
解决方案
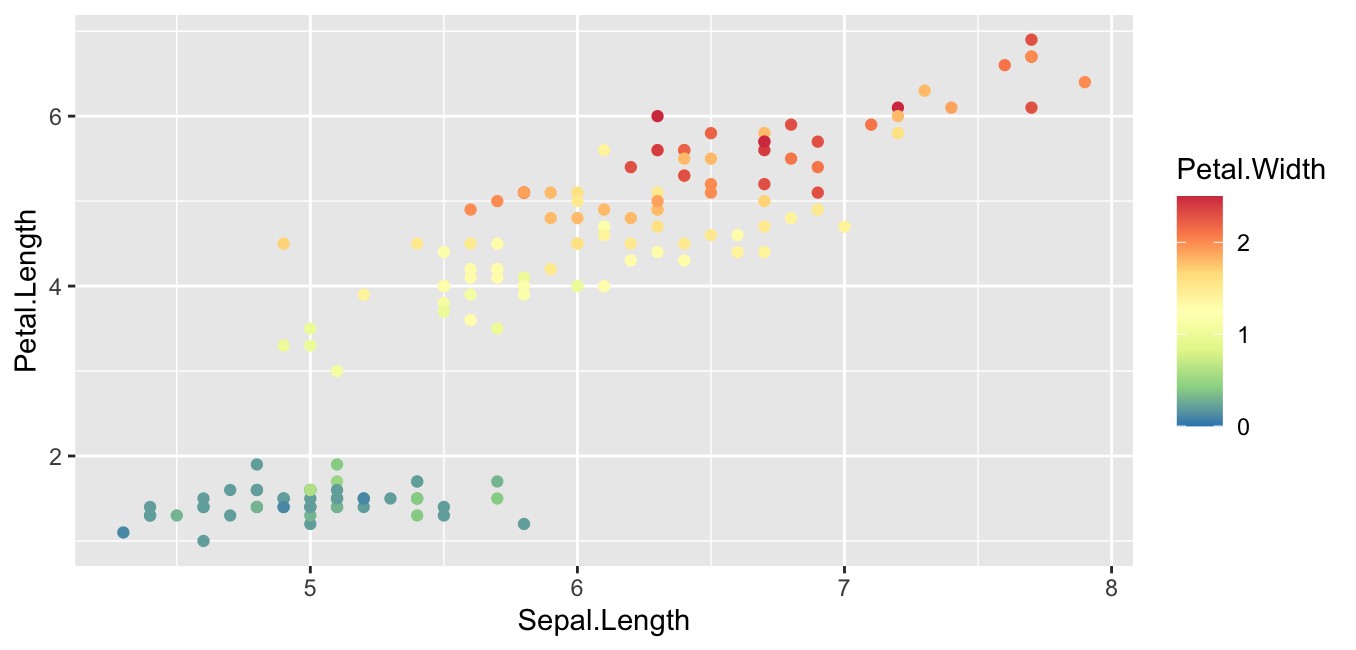
你可以使用 + expand_limits(color = 0) 来强制图例包含0。
或者,因为这已被标记为已废弃(2025年的讨论在这里):
  scale_colour_distiller(palette = "Spectral",
                         breaks = c(0,1.0,2.0),
                         limits = ~range(.x, 0))
站内所有文章版权归属LeftHeroAI导航站,无授权禁止任何主体转载、抄袭、复制内容,亦不得私自架设镜像站点。一经侵权,本站将通过法律途径追责。
相关文章






汇集全球数千款 AI 工具,每日持续更新,配套 AI 开发学习资源,轻松用 AI 提升工作效率。快捷键 Ctrl+D/⌘+D 一键收藏本站。