


在ggplot中添加地图边界和坐标标签
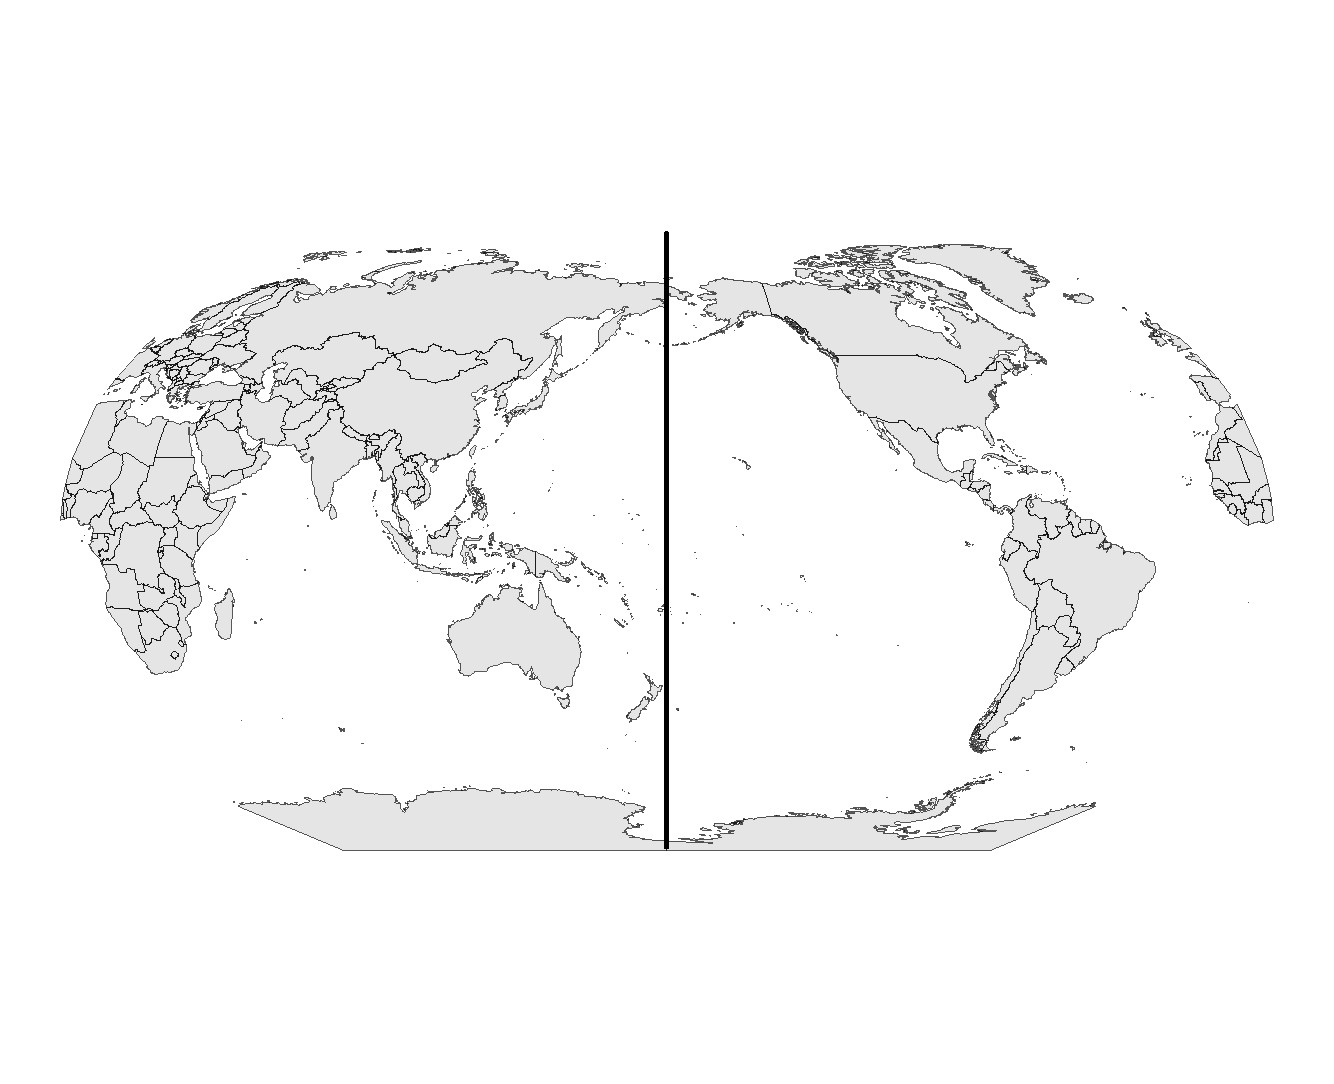
我正在尝试用ggplot创建一个以太平洋为中心的Robinson投影。当我把边界图层添加到地图时,线条没有在边缘显示,而是在中间出现。我认为这可能与投影有关,但我不知道该如何解决。
library(sf)
library(ggplot2)
library(rnaturalearth)

world <- ne_countries(scale = "medium", returnclass = "sf") |>
  st_set_crs(4326)

robinson <- "+proj=robin +lon_0=180 +x_0=0 +y_0=0 +ellps=WGS84 +datum=WGS84 +units=m +no_defs"

world_robinson <- world |>
  st_break_antimeridian(lon_0 = 180) |>
  st_transform(crs = robinson)

border <- st_graticule() |>
  st_bbox() |>
  st_as_sfc() |>
  st_transform(4326) |>
  st_segmentize(500000) |>
  st_transform("+proj=robin +lon_0=180 +x_0=0 +y_0=0 +ellps=WGS84 +datum=WGS84 +units=m +no_defs") |>
  st_cast("POLYGON")

ggplot() +
  geom_sf(data = world_robinson)+
  geom_sf(data = border, color = "black", linewidth = 1)+
  theme_void()
解决方案
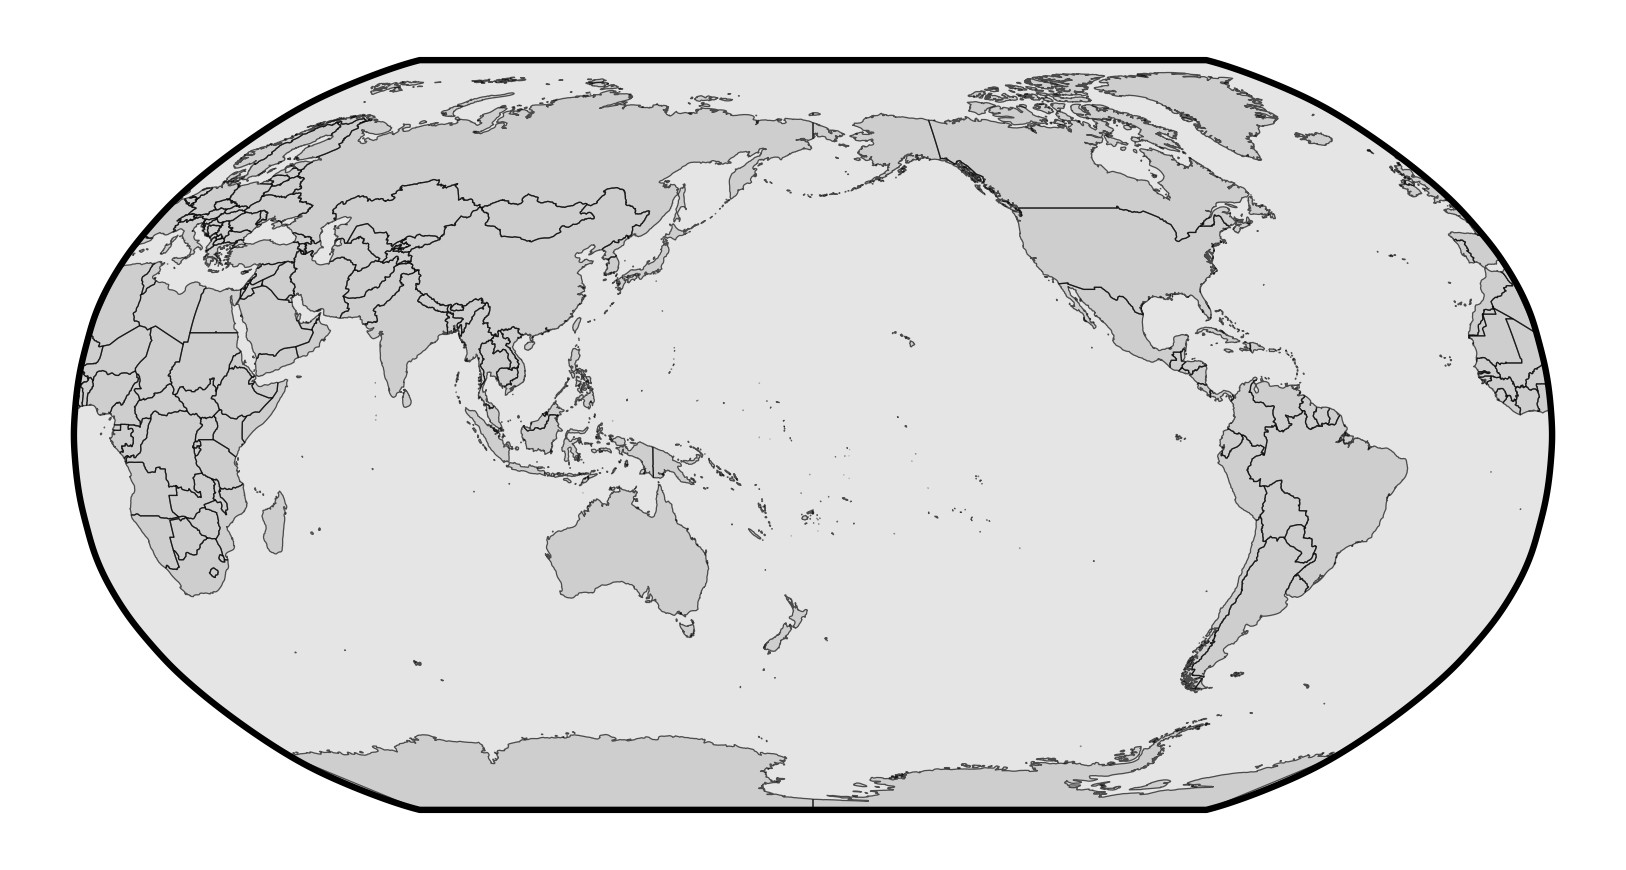
你可以把边界在0-360的空间内构建为一个多边形,这样它就不会跨越反日界线,然后再进行重投影。
lats <- seq(-90, 90, by = 1)
lons_left <- rep(-0.001, length(lats))
lons_right <- rep(360.001, length(lats))

border_coords <- rbind(
  cbind(lons_right, lats),
  cbind(rev(lons_left), rev(lats))
)
border_coords <- rbind(border_coords, border_coords[1, ])

border <- suppressWarnings(
  st_polygon(list(border_coords)) |>
  st_sfc(crs = 4326) |>
  st_segmentize(100000) |>
  st_transform(robinson)
)

ggplot() +
  geom_sf(data = world_robinson) +
  geom_sf(data = border, color = "black", linewidth = 1) +
  theme_void()
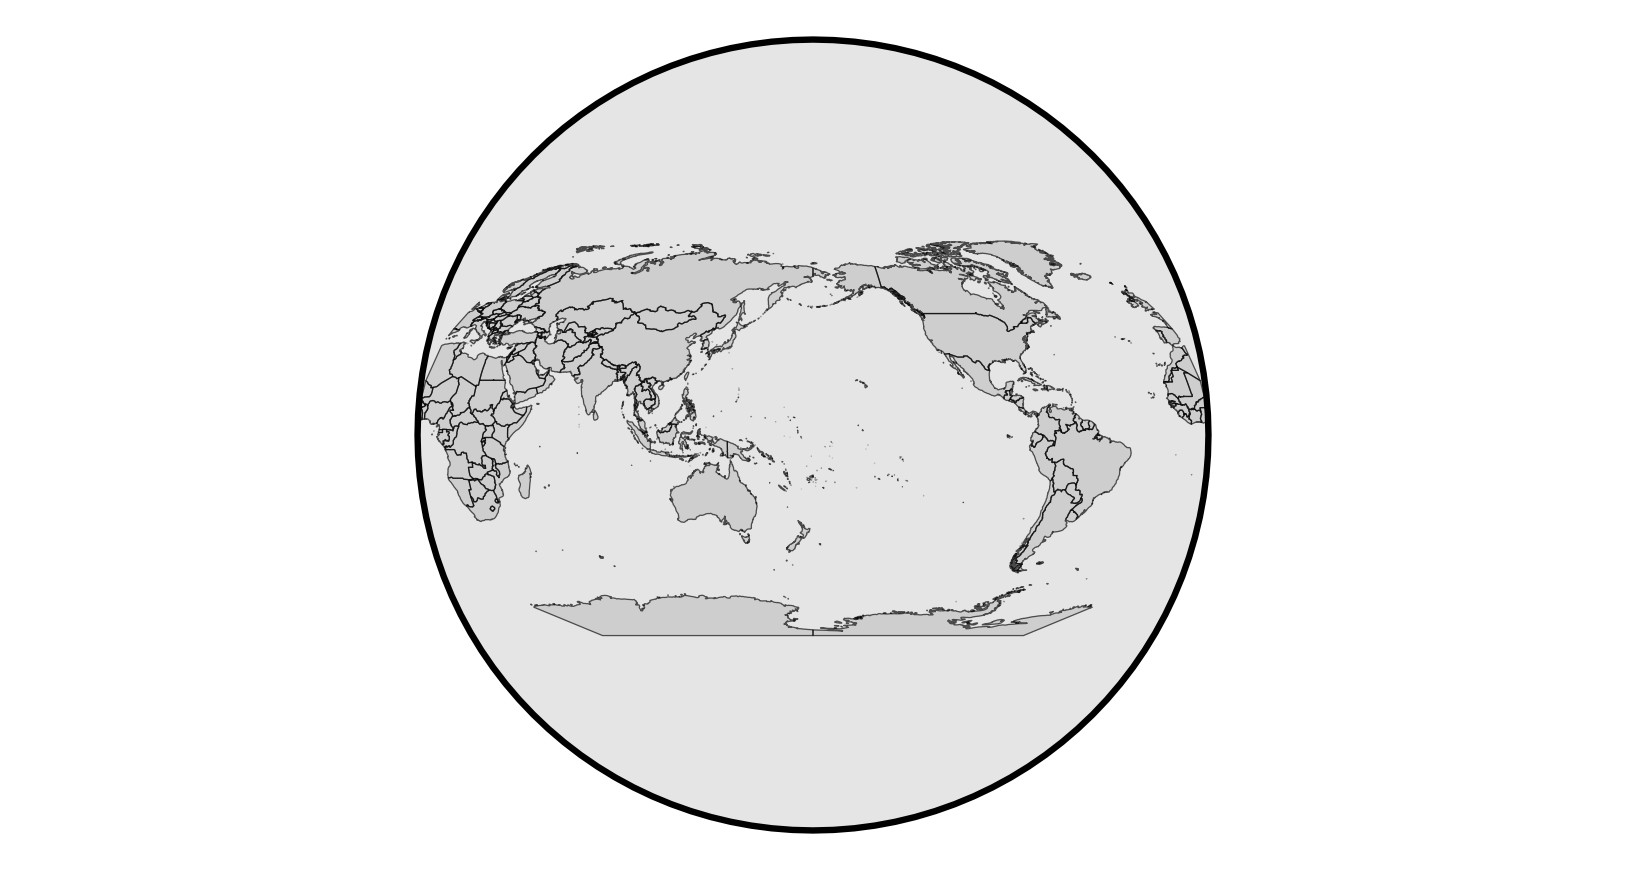
如果你对圆形边界也没问题(其实罗宾逊投影是椭圆形的),你可以在投影坐标系的原点对一个点进行缓冲来近似边界。
border <- st_point(c(0, 0)) |>
  st_sfc(crs = robinson) |>
  st_buffer(dist = 17005833) |>
  st_segmentize(500000)

ggplot() +
  geom_sf(data = world_robinson) +
  geom_sf(data = border, color = "black", linewidth = 1) +
  theme_void()
创建于2026-03-12,使用 reprex v2.1.1
站内所有文章版权归属LeftHeroAI导航站,无授权禁止任何主体转载、抄袭、复制内容,亦不得私自架设镜像站点。一经侵权,本站将通过法律途径追责。
相关文章






汇集全球数千款 AI 工具,每日持续更新,配套 AI 开发学习资源,轻松用 AI 提升工作效率。快捷键 Ctrl+D/⌘+D 一键收藏本站。