


gratia::draw中对图形坐标轴刻度进行变换时出现的问题
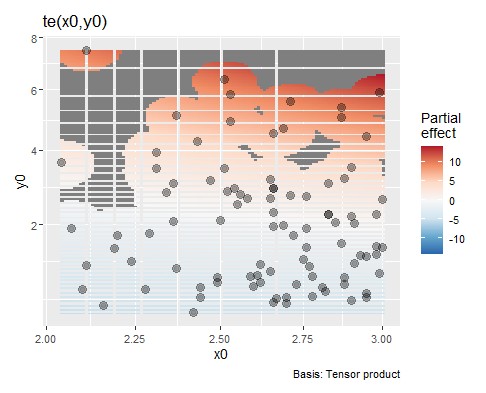
使用这个示例,在对坐标轴的刻度进行变换时会出现不希望看到的白线。这个问题如何解决?
library("mgcv")
library("qgam")
library("gratia")
library("ggplot2")
library("dplyr")
library("scales")
# qgam
qg0 <- qgam(z0 ~ te(x0, y0, k=c(5,5), bs=c("cr","cr")), data=dat0, qu=0.5)
# plot using gratia
sm0 <- smooth_estimates(qg0); sm0
dw0 <- draw(qg0)
dw0$layers[[2]] <- NULL
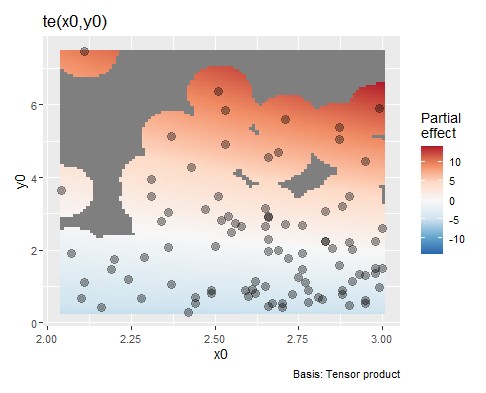
在变换坐标轴刻度之前:
dw0 +
  geom_point(data=dat0, aes(x=x0, y=y0), size=3, shape=21, fill="black", alpha=0.3)
在变换坐标轴刻度之后:
dw0 +
  geom_point(data=dat0, aes(x=x0, y=y0), size=3, shape=21, fill="black", alpha=0.3) +
  scale_x_continuous(trans = modulus_trans(0.5)) +
  scale_y_continuous(trans = modulus_trans(0.5))
数据:
dat0 <-
structure(list(x0 = c(2.44, 2.76, 2.53, 2.31, 2.9, 2.51, 2.82,
2.98, 2.53, 2.42, 2.66, 2.36, 2.78, 2.44, 2.24, 2.31, 2.65, 2.93,
2.71, 2.62, 2.66, 2.37, 2.99, 2.9, 2.7, 2.9, 2.98, 2.55, 2.28,
2.36, 2.19, 2.85, 2.75, 2.65, 2.69, 2.77, 2.71, 2.2, 2.54, 2.52,
2.49, 2.7, 2.83, 2.99, 2.87, 2.66, 2.65, 2.6, 2.16, 2.04, 2.66,
2.11, 2.81, 2.76, 2.88, 2.49, 2.56, 2.87, 2.98, 2.59, 2.91, 2.11,
2.58, 2.72, 2.47, 2.87, 2.51, 2.07, 2.95, 2.66, 2.88, 2.61, 2.62,
2.5, 3, 2.76, 2.91, 2.67, 2.29, 2.83, 2.43, 2.37, 2.78, 3, 2.1,
2.34, 2.73, 2.95, 2.69, 2.88, 2.95, 2.95, 2.83, 2.66), y0 = c(0.7,
1.48, 5.85, 3.47, 0.48, 6.38, 0.64, 2.24, 4.9, 0.29, 4.54, 2.08,
0.9, 0.53, 1.2, 3.95, 2.65, 1.32, 5.59, 1.14, 1.96, 1.06, 5.9,
2.2, 0.54, 3.49, 1.51, 2.5, 0.67, 3.05, 1.47, 2.05, 1.25, 1.01,
1.98, 1.1, 2.72, 1.75, 2.92, 2.83, 0.89, 0.43, 2.25, 0.96, 1.57,
2.92, 3.15, 0.72, 0.41, 3.64, 2.9, 7.48, 0.71, 1.91, 3.19, 0.8,
2.74, 5.05, 1.35, 0.9, 1.15, 1.12, 2.65, 1.76, 3.12, 5.38, 3.47,
1.92, 1.31, 2.29, 0.89, 0.92, 0.8, 2.1, 1.5, 2.69, 2.03, 0.52,
1.79, 3.06, 4.28, 5.13, 0.55, 2.61, 0.67, 2.8, 0.77, 0.61, 4.7,
0.77, 0.54, 4.44, 2.25, 0.46), z0 = c(1.7, 4.09, 14.79, 8.01,
1.4, 16.02, 1.81, 6.66, 12.39, 0.7, 12.04, 4.91, 2.51, 1.29,
2.69, 9.12, 7.02, 3.86, 15.14, 2.98, 5.2, 2.51, 17.66, 6.37,
1.46, 10.12, 4.5, 6.37, 1.52, 7.19, 3.22, 5.84, 3.45, 2.69, 5.32,
3.04, 7.37, 3.86, 7.42, 7.13, 2.22, 1.17, 6.37, 2.87, 4.5, 7.78,
8.36, 1.87, 0.88, 7.42, 7.72, 15.79, 1.99, 5.26, 9.18, 1.99,
7.02, 14.5, 4.03, 2.34, 3.33, 2.37, 6.84, 4.79, 7.72, 15.44,
8.71, 3.98, 3.86, 6.08, 2.57, 2.4, 2.1, 5.26, 4.5, 7.42, 5.9,
1.4, 4.09, 8.65, 10.41, 12.16, 1.52, 7.83, 1.4, 6.55, 2.1, 1.81,
12.63, 2.22, 1.58, 13.1, 6.37, 1.23)), row.names = c(NA, -94L
), class = "data.frame")
解决方案
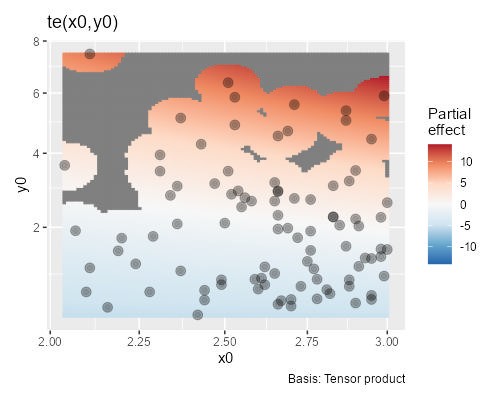
与其使用 scale_*_continuous(),不如使用 coord_transform()。虽然会有一个警告,但可以安全忽略。这只是 ggplot2 捕捉到一个问题并切换到正确/合适的 geom_*():
library(ggplot2)

dw0 +
  geom_point(
    data = dat0,
    aes(x0, y0),
    size = 3,
    shape = 21,
    fill = "black",
    alpha = 0.3
    ) +
  coord_transform(
    x = modulus_trans(0.5),
    y = modulus_trans(0.5)
  )
# `geom_raster()` only works with linear coordinate systems, not
# `coord_transform()`.
# ℹ Falling back to drawing as `geom_rect()`.
站内所有文章版权归属LeftHeroAI导航站,无授权禁止任何主体转载、抄袭、复制内容,亦不得私自架设镜像站点。一经侵权,本站将通过法律途径追责。
相关文章






汇集全球数千款 AI 工具,每日持续更新,配套 AI 开发学习资源,轻松用 AI 提升工作效率。快捷键 Ctrl+D/⌘+D 一键收藏本站。