


Plotly等值区域地图:数据点在地图上未随机出现
我正在尝试使用Plotly创建一个带动画的分级着色地图,用来展示哪些国家在何时对某项政策进行了合法化。基本上,这张地图会按年份逐帧显示,国家会根据是否让某项政策合法化、是否禁止它,或对该政策添加了其他条件,而以不同颜色来标注。
然而,随着年份的推进,某些国家的数据点并未正确显示。
基本上,我的源数据看起来像下面的图片 -
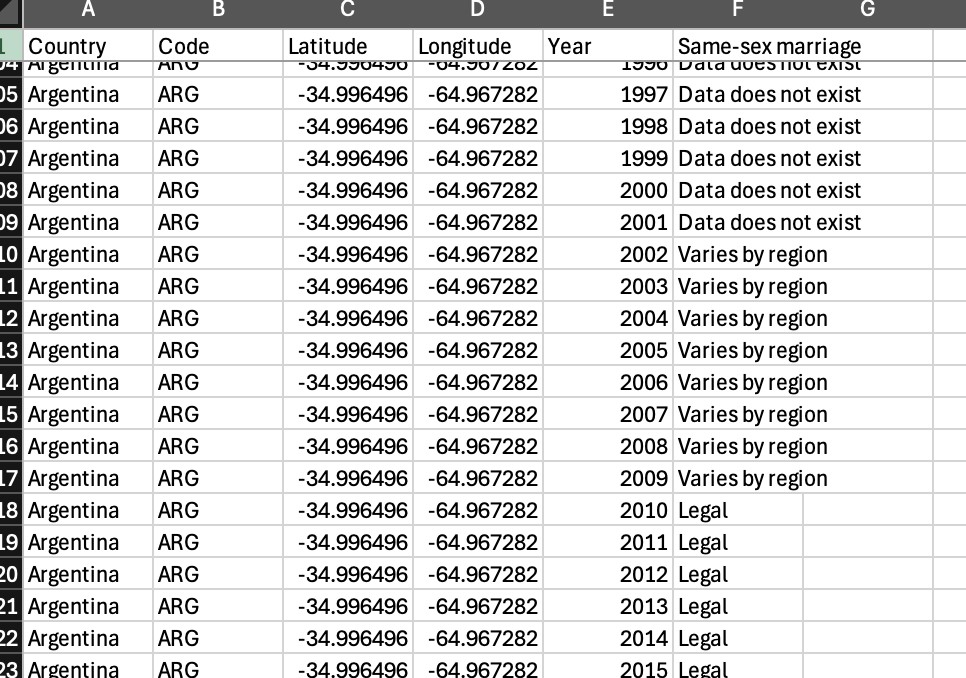
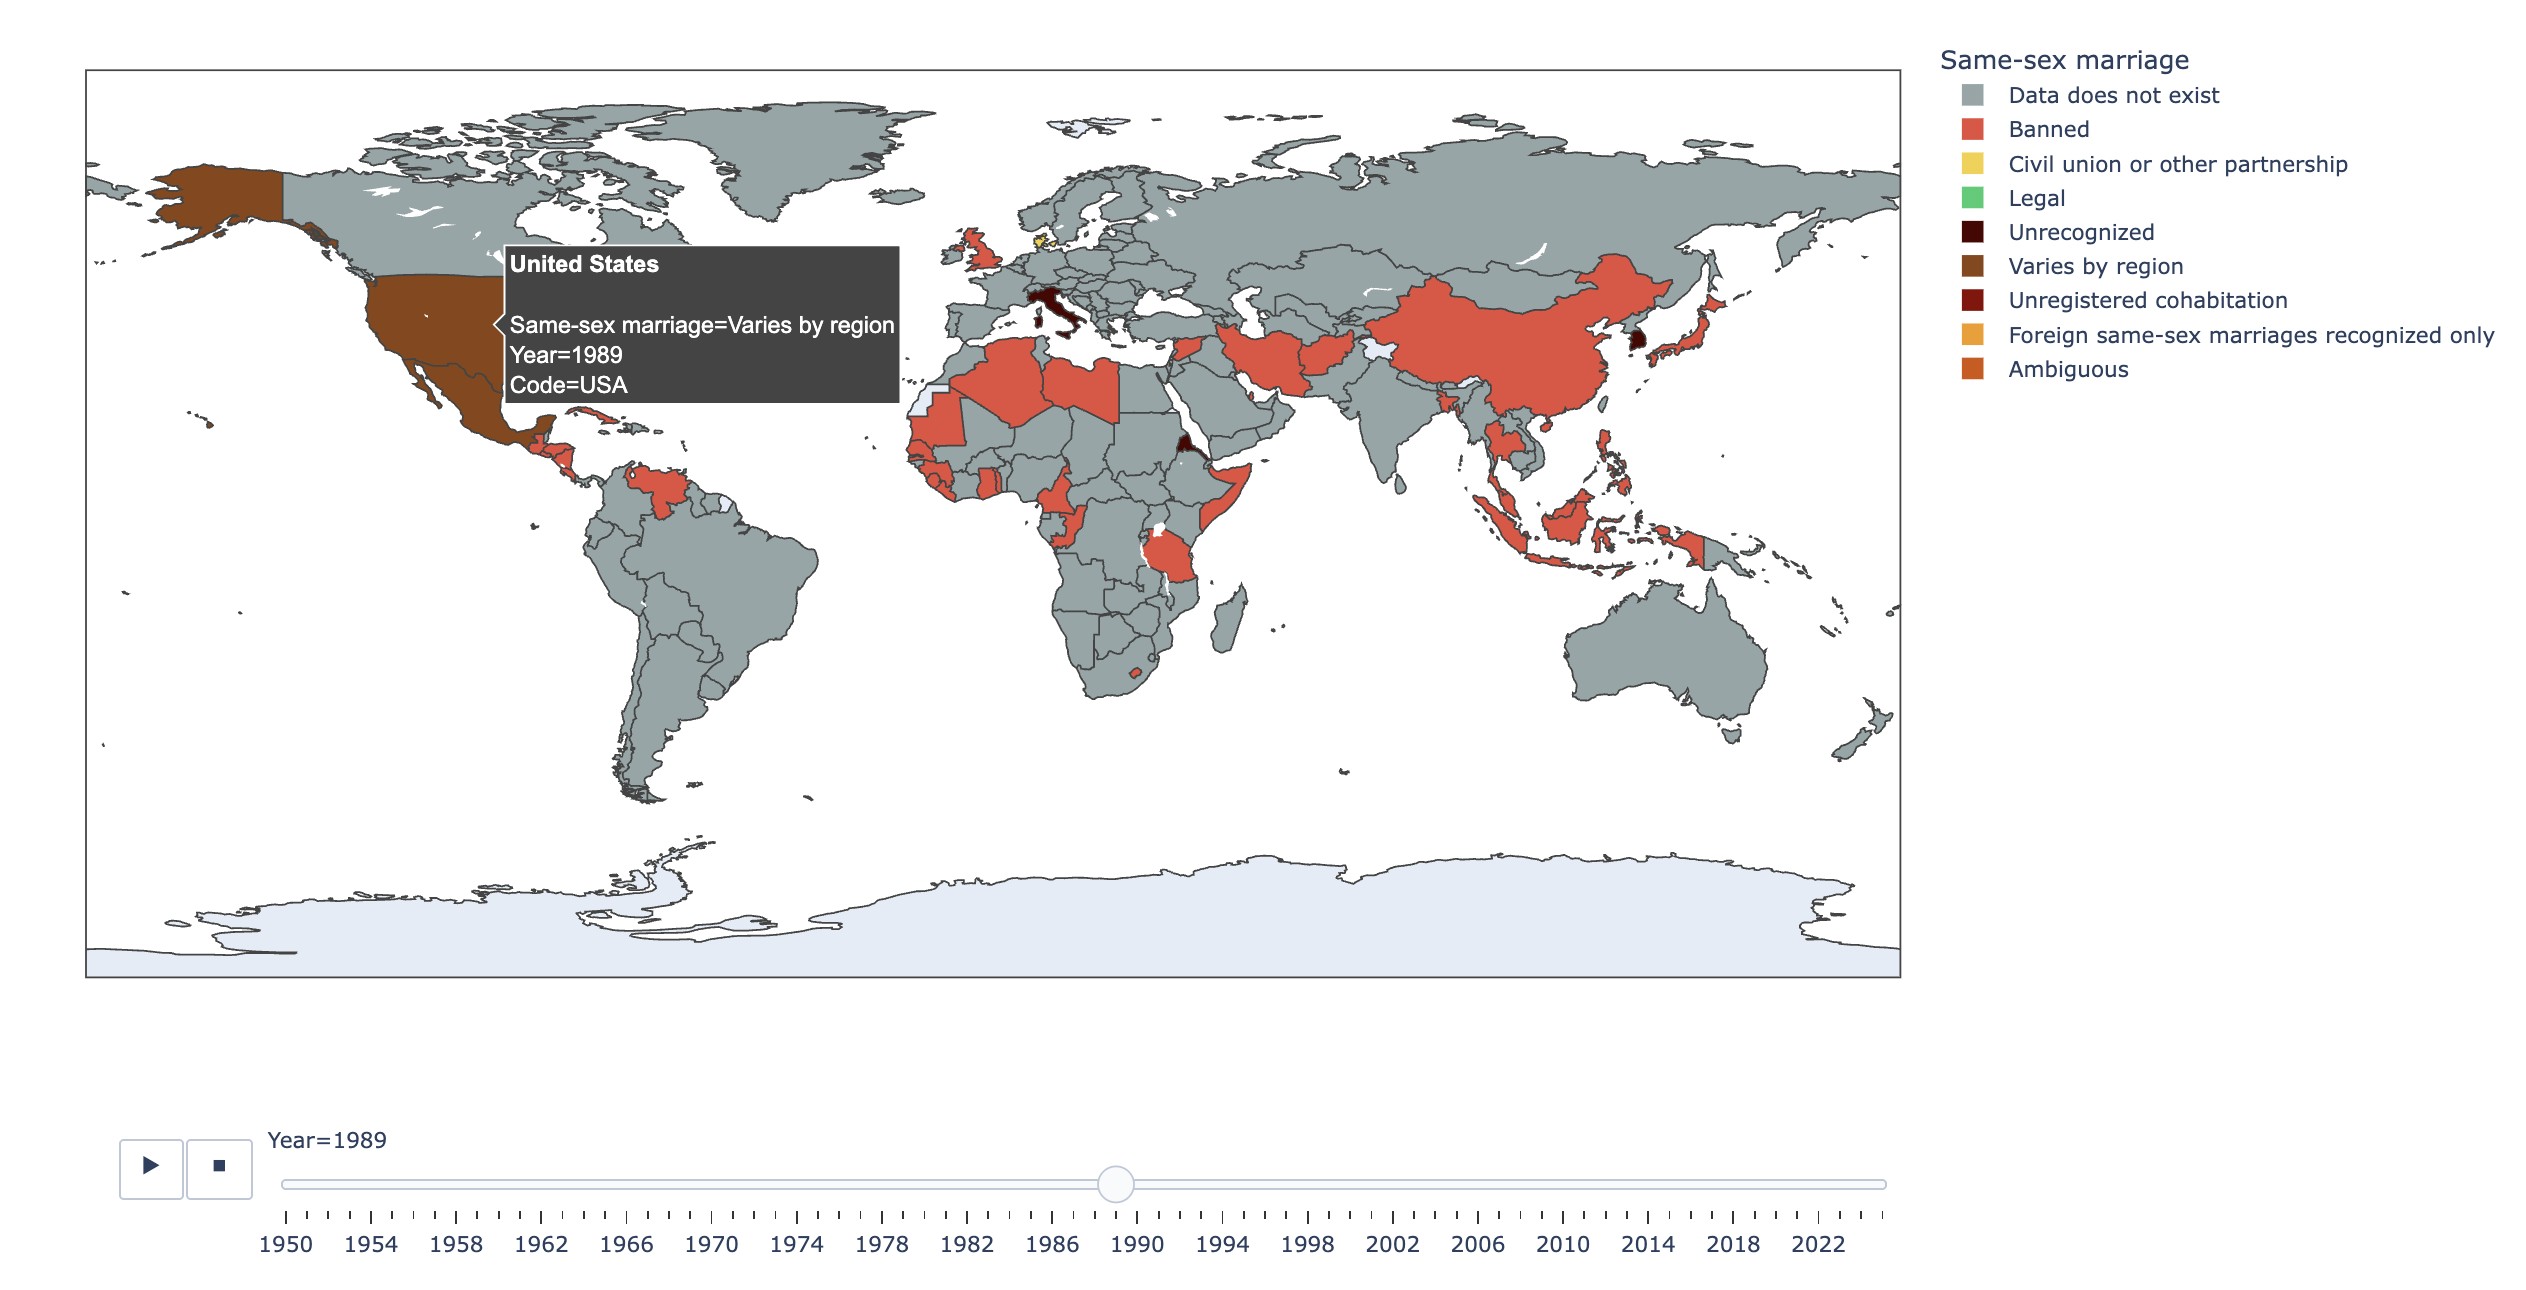
在我的地图中,某些年份,合法状态会直接消失,国家变成空白。这是该地图 地图。如果把时间滑到1988年并观察它切换到1989年,你会发现美国变为空白。然而,在数据源中(数据源),1988年和1989年有美国的行,且这两行之间的数值简直没有差异(甚至在“同性婚姻”一栏中也看不出合法状态的差异)。类似的问题也出现在其他国家,例如印度在2012到2013年之间。
这是我用来创建地图的代码 -
# Convert same-sex marriage column to categorical data type.

full_legalisation["Same-sex marriage"] = full_legalisation["Same-sex marriage"].astype("category")

print(
    full_legalisation["Same-sex marriage"].dtype
)

# Create chloropleth map.

color_discrete_map = {
    "Unrecognized": "#4B0000",
    "Varies by region" : "#8B4513",
    "Unregistered cohabitation": "#8B0000",
    "Banned": "#E74C3C",
    "Civil union or other partnership": "#F4D03F",
    "Legal": "#2ECC71",
    "Foreign same-sex marriages recognized only": "#F39C12",
    "Ambiguous": "#D35400",
    "Data does not exist": "#95A5A6"
}

map_entire = px.choropleth(
    full_legalisation,
    locations="Code",
    color="Same-sex marriage",
    hover_name="Country",
    animation_frame="Year",
    color_discrete_map=color_discrete_map
)
我在数据或代码中找不到会导致此choropleth(分级着色地图)动画问题的错误。有什么想法吗?
解决方案
我也认为这种行为与数据不一致,可能是Plotly的一个bug。
在重现你描述的从1988年到1989年的行为时,我发现plotly只会为在该年份实际存在的 Same-sex marriage 状态创建图例条目,并且从1988年到1989年的唯一状态数量也在变化。
所以,尽管我不清楚为什么这会导致美国变成空白(看起来像是空值),但我认为为每一年添加虚拟行以确保所有 Same-sex marriage 在每一年都存在,似乎可以修复这个问题——看起来确实如此。
以下代码遍历你的数据集里的每一个年份,确定在该年份缺失的九种可能的同性婚姻状态中的哪一些,然后为该年份缺失的每一个 Same-sex marriage 状态创建新行,最后创建一个扩展数据集,使每一年都包含这九种状态。
import pandas as pd
import plotly.express as px

import plotly.io as pio
pio.renderers.default = "browser"

full_legalisation = pd.read_csv("country_year_legalisation.csv")

# Convert same-sex marriage column to categorical data type.

# Create chloropleth map.

color_discrete_map = {
    "Unrecognized": "#4B0000",
    "Varies by region" : "#8B4513",
    "Unregistered cohabitation": "#8B0000",
    "Banned": "#E74C3C",
    "Civil union or other partnership": "#F4D03F",
    "Legal": "#2ECC71",
    "Foreign same-sex marriages recognized only": "#F39C12",
    "Ambiguous": "#D35400",
    "Data does not exist": "#95A5A6"
}

all_marriage_types = set(color_discrete_map.keys())

# full_legalisation["Same-sex marriage"] = full_legalisation["Same-sex marriage"].astype("category")
full_legalisation_augmented = full_legalisation.copy()
for year, df_group in full_legalisation.groupby("Year"):
    all_marriage_in_year = set(df_group['Same-sex marriage'].unique())
    marriage_types_not_in_year = list(all_marriage_types.difference(all_marriage_in_year))
    # print(f"year = {group} doesn't have the following marriage types {marriage_types_not_in_year}")
    n_rows = len(marriage_types_not_in_year)
    new_rows = pd.DataFrame({
        'Country': [None]*n_rows,
        'Code': [None]*n_rows,
        'Latitude': [None]*n_rows,
        'Longitude': [None]*n_rows,
        'Year': [year]*n_rows,
        'Same-sex marriage': marriage_types_not_in_year
    })
    full_legalisation_augmented = pd.concat([full_legalisation_augmented, new_rows])

print(
    full_legalisation_augmented["Same-sex marriage"].dtype
)


map_entire = px.choropleth(
    full_legalisation_augmented,
    locations="Code",
    color="Same-sex marriage",
    hover_name="Country",
    animation_frame="Year",
    color_discrete_map=color_discrete_map
)

map_entire.show()
站内所有文章版权归属LeftHeroAI导航站,无授权禁止任何主体转载、抄袭、复制内容,亦不得私自架设镜像站点。一经侵权,本站将通过法律途径追责。
相关文章






汇集全球数千款 AI 工具,每日持续更新,配套 AI 开发学习资源,轻松用 AI 提升工作效率。快捷键 Ctrl+D/⌘+D 一键收藏本站。