


如何在D3.js中把点正确投影到地图上?
我有一组经纬度数据,想把它们作为点绘制在一个投影到可视化空间的地图之上。我把点的坐标通过与地图相同的投影进行投影,但我的点看起来有些偏离。我知道我传入的经度和纬度的顺序是正确的。我只是觉得在数据变换方面可能缺少一些根本性的东西,例如这里描述的内容 这里 的第2.1.2节(一个Javascript问题),点的坐标出错是出于某种原因(数据问题),或者地图的中心与点的中心之间存在某种差异。
下面是我的JavaScript代码。
地图数据:https://cdn.jsdelivr.net/npm/us-atlas@3/states-10m.json 来源
<!DOCTYPE html>
<meta charset="utf-8" />

<body>
  <div id="vizook" style="position:relative; width:100vw; height:100vh; background: black;"></div>
  <script src="https://d3js.org/d3.v5.min.js"></script>
  <script src="https://unpkg.com/[email protected]/dist/topojson.js"></script>
  <script>
    d3.json("https://cdn.jsdelivr.net/npm/us-atlas@3/states-10m.json")
      .then(json => {
        // Handle data
         const mapdata = json;
         console.log(mapdata);

         var selected = d3.set(['02', '15', '60', '66', '69', '72', '78']);
         const usfilt = mapdata;
         usfilt.objects.states.geometries = mapdata.objects.states.geometries.filter(function(d) { return !selected.has(d.id); });

         const portlist = [{port: 'KEY WEST, FL', lat: 24.5551, lng: -81.7811 },
                      {port: 'GALVESTON, TX', lat: 29.3036, lng: -94.7975},
                      {port: 'NEW YORK, NY', lat: 40.6943, lng: -73.9249},
                      {port: 'BOSTON, MA', lat: 42.3118, lng: -71.0852}];

         var geomap = topojson.feature(usfilt, usfilt.objects.states);
    /////////////////////////////////////////////////////////////////////////////
    // attributes of bounding div


          window.addEventListener("resize", () => {
            let divrect = document.querySelector("#vizook")
              .getBoundingClientRect();

            // total width and hieght
            divw = divrect.width;
            divh = divrect.height - 50;
            divtop = divrect.y;
            divbot = divrect.bottom;
            divleft = divrect.left;

            svg1.attr('width', divw)
              .attr('height', divh);

            // US Map
            var proj = d3.geoAlbers()
              .fitSize([divw, divh], geomap)

            var path = d3.geoPath().projection(proj);

            usmap
              .attr("class", "usmap")
              .attr("d", path)
              .attr("stroke", "#333333");

            portloc
              .attr("cx", d => {return proj([d.lng, d.lat])[0]; })
              .attr("cy", d => {return proj([d.lng, d.lat])[1]; })
              .attr("r", 5)
              .attr("fill", "#FFFFFF");

          });

          const vizspace = d3.select('#vizook');

          var svg1 = vizspace
              .append("svg")
              .attr('class', "svgook");

          var usmap = svg1.append("g")
            .datum(geomap)
            .append("path")

          var portloc = svg1.append("g")
            .selectAll("circle")
            .data(portlist)
            .join("circle")
              })
      .catch(error => {
        // Handle error
        console.error(error);
        });


  </script>
</body>
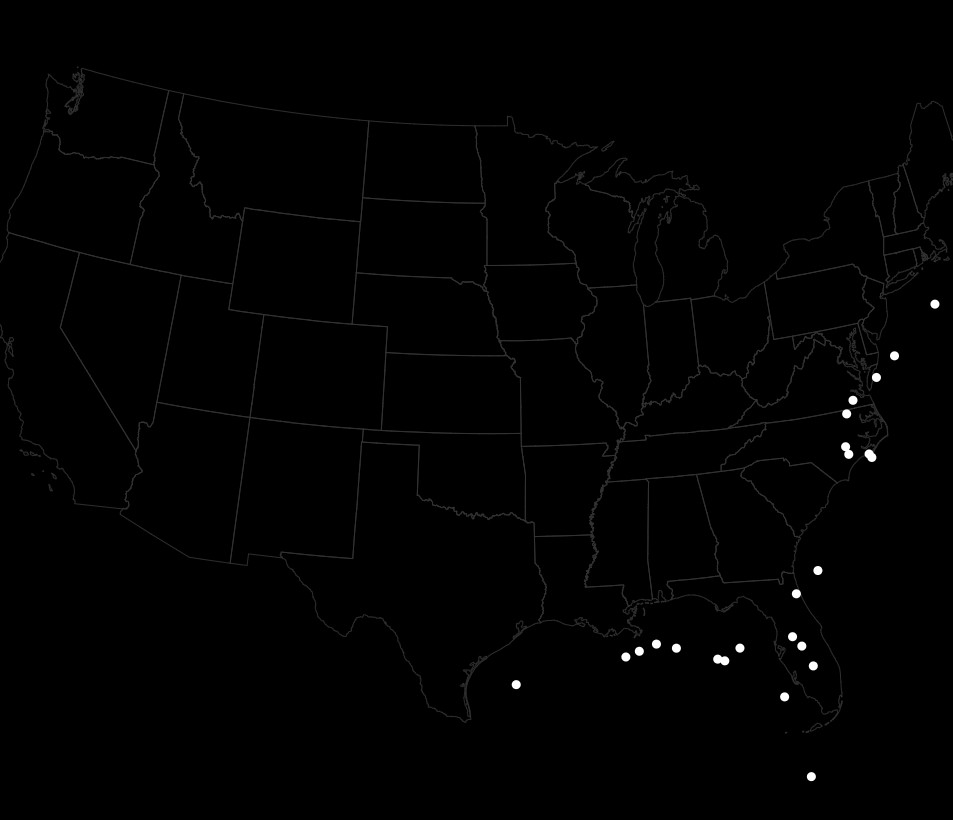
生成的可视化结果如下:
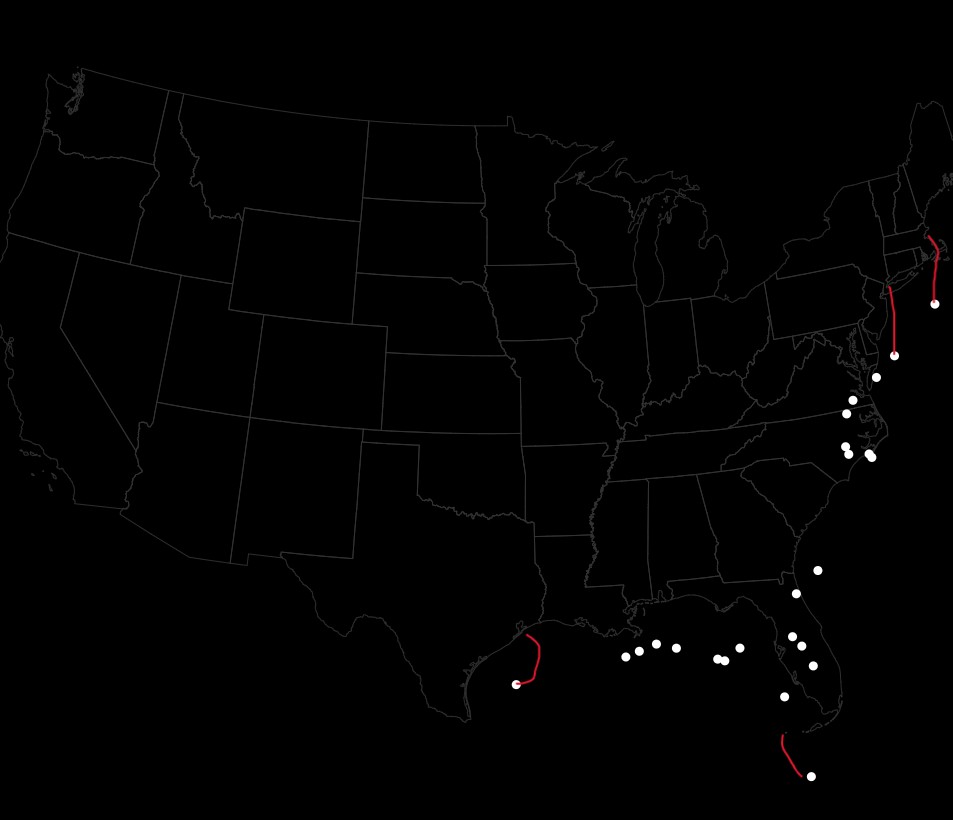
这些点应该落在沿海城镇和岛屿城镇上:
解决方案
我还不知道原因,但这段代码按预期工作。我的猜测是,我在CSS上可能把某些东西弄乱了。
<!DOCTYPE html>
<meta charset="utf-8" />

<body>
  <div id="vizook" style="position:relative; width:100vw; height:100vh; background: black;"></div>
  <script src="https://d3js.org/d3.v5.min.js"></script>
  <script src="https://unpkg.com/[email protected]/dist/topojson.js"></script>
  <script>
    d3.json("https://cdn.jsdelivr.net/npm/us-atlas@3/states-10m.json")
      .then(json => {
        // Handle data
        const mapdata = json;
        console.log(mapdata);

        var selected = d3.set(['02', '15', '60', '66', '69', '72', '78']);
        const usfilt = mapdata;
        usfilt.objects.states.geometries = mapdata.objects.states.geometries.filter(function(d) {
          return !selected.has(d.id);
        });

        const portlist = [{
            port: 'KEY WEST, FL',
            lat: 24.5551,
            lng: -81.7811
          },
          {
            port: 'GALVESTON, TX',
            lat: 29.3036,
            lng: -94.7975
          },
          {
            port: 'NEW YORK, NY',
            lat: 40.6943,
            lng: -73.9249
          },
          {
            port: 'BOSTON, MA',
            lat: 42.3118,
            lng: -71.0852
          }
        ];

        var geomap = topojson.feature(usfilt, usfilt.objects.states);
        /////////////////////////////////////////////////////////////////////////////
        // attributes of bounding div


        window.addEventListener("resize", () => {
          let divrect = document.querySelector("#vizook")
            .getBoundingClientRect();

          // total width and hieght
          divw = divrect.width;
          divh = divrect.height - 50;
          divtop = divrect.y;
          divbot = divrect.bottom;
          divleft = divrect.left;

          svg1.attr('width', divw)
            .attr('height', divh);

          // US Map
          var proj = d3.geoAlbers()
            .fitSize([divw, divh], geomap)

          var path = d3.geoPath().projection(proj);

          usmap
            .attr("class", "usmap")
            .attr("d", path)
            .attr("stroke", "#333333");

          portloc
            .attr("cx", d => {
              return proj([d.lng, d.lat])[0];
            })
            .attr("cy", d => {
              return proj([d.lng, d.lat])[1];
            })
            .attr("r", 5)
            .attr("fill", "#FFFFFF");

        });

        const vizspace = d3.select('#vizook');

        var svg1 = vizspace
          .append("svg")
          .attr('class', "svgook");

        var usmap = svg1.append("g")
          .datum(geomap)
          .append("path")

        var portloc = svg1.append("g")
          .selectAll("circle")
          .data(portlist)
          .join("circle")

        window.dispatchEvent(new Event('resize'));
      })
      .catch(error => {
        // Handle error
        console.error(error);
      });
  </script>
</body>
站内所有文章版权归属LeftHeroAI导航站,无授权禁止任何主体转载、抄袭、复制内容,亦不得私自架设镜像站点。一经侵权,本站将通过法律途径追责。
相关文章






汇集全球数千款 AI 工具,每日持续更新,配套 AI 开发学习资源,轻松用 AI 提升工作效率。快捷键 Ctrl+D/⌘+D 一键收藏本站。