


ggtern三元图中的负坐标
我正在尝试用ggtern绘制一个三元图,但其中一个(或几个)顶点的坐标是负值。实际上图像是这样的:
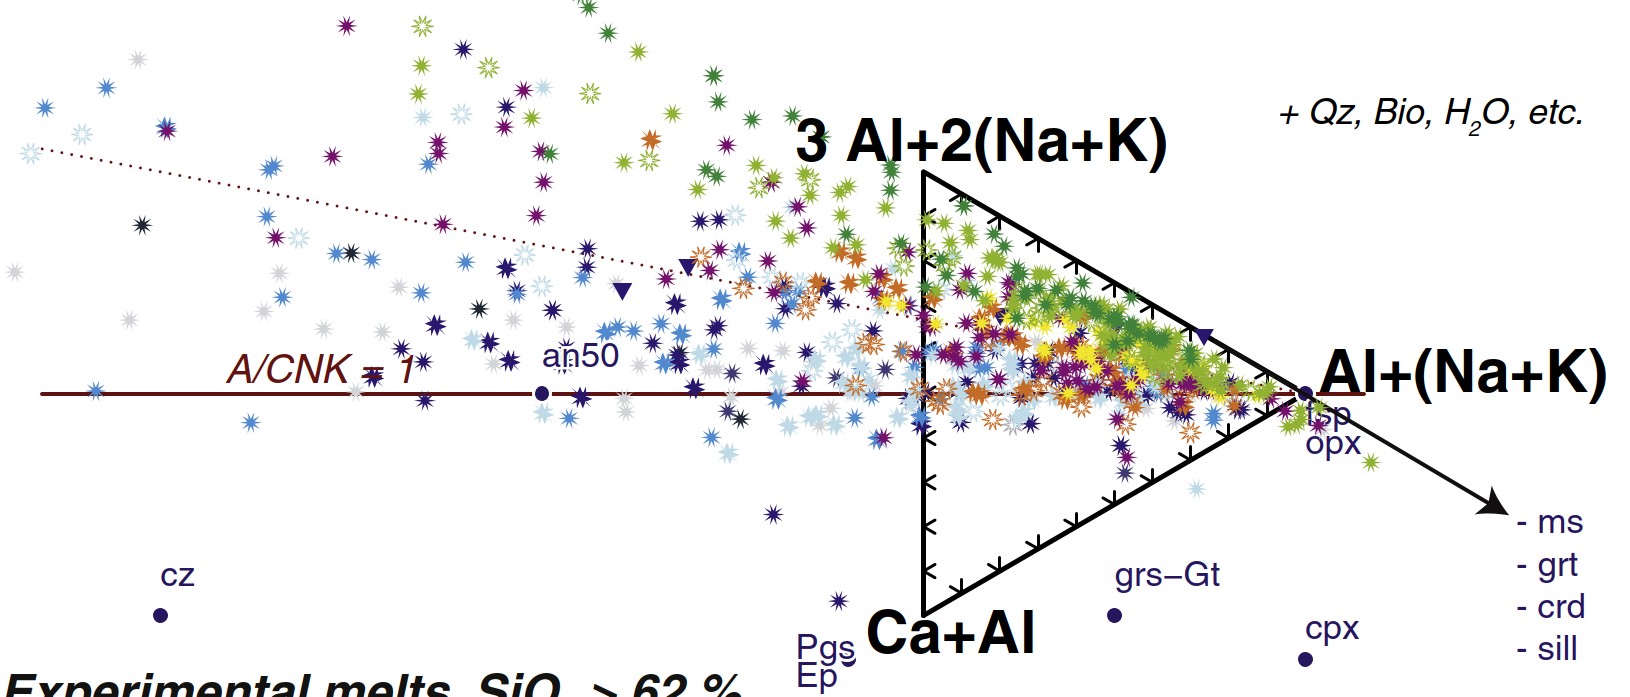
我需要对ggtern() 的绘图执行“缩放”,以达到这个效果;不过ggtern对 coord_* 的兼容性不太好,tern_limits在给出负值时会报错。
在纯R 中做起来相当简单(但你会失去ggtern的大部分优点,而且坐标轴需要你自己手动绘制)。它也可以通过ggplot的变体来实现。例如:
df = tibble(aa = c(1,-6,1), bb= c(1,3,2), cc = c(4,-8,1))

df <- df %>%  mutate(sum = aa + bb + cc,
          aa_s = aa / sum,
          bb_s = bb / sum,
          cc_s = cc / sum,
          xcoord = sqrt(3)/2*cc_s,
          ycoord = (bb_s-aa_s)/2 )

frame = tibble(x=c(0,0.5,1,0),y=c(0,sqrt(3)/2,0,0))

df %>% ggplot()+
  geom_point(aes(x=xcoord,y=ycoord))+
  geom_path(data=frame,aes(x=x,y=y))+
  theme_void()+coord_equal(xlim=c(0,1),ylim=c(-1,1))+
  annotate(geom="text",x=c(-0.05,0.5,1.05),y=c(0,0.9,0),label=c("AA","BB","CC"))
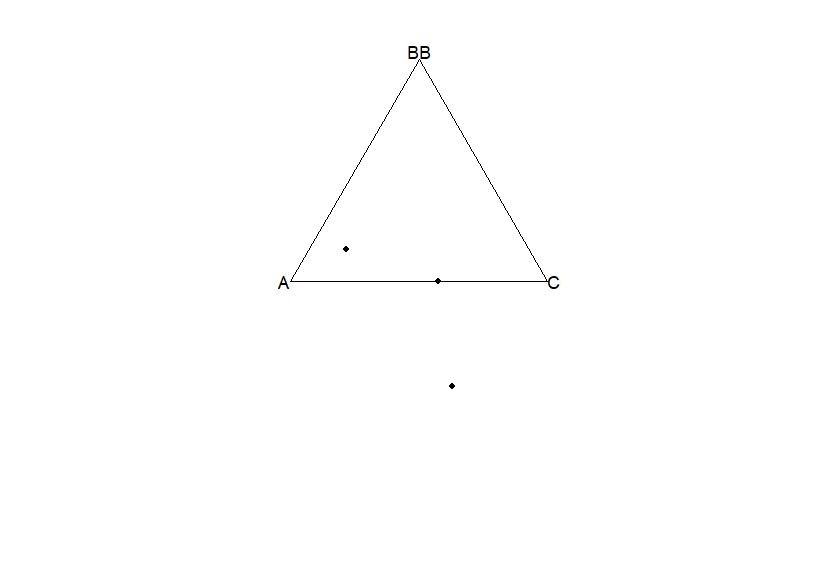
(为了清晰起见,我把旋转部分放在一边,思路大概如下:
  Xr <- ( X * cospi(rotation / 180) - Y * sinpi(rotation / 180) )
  Yr <- ( X * sinpi(rotation / 180) + Y * cospi(rotation / 180) )
在ggtern中就更简单了,只需添加 ... +theme_rotate(degrees = rotation)。
在ggtern中,然而,类似这样的代码
ggtern(df,aes(x=aa,y=bb,z=cc))+
  geom_point()+
  tern_limit(T=1,L=-6,R=-8)
会得到如下错误
Erreur : Invalid Ternary Limits, Each Point Must Sum to Unity... De plus : Message d'avis : Solution to limits produces range outside of [0,1] for some scale
(或者如果你把数值改成例如 (6,-2,-3) :
Invalid limits, solution produces zero ranges on some scales
这很有道理(因为ggtern期望在三角形内缩放,而不是在外部),但这并不能帮助解决问题。
1 是的,在某些情况下,负坐标和在三角形外的点是合理的。我不想把投影和坐标映射讲得过于深入;如果你感兴趣,可以参考如Spear FS (1994) Metamorphic phase equilibria and pressure–temperature-time paths. Mineralogical Society of America, Washington, 799页。 [如果记忆没错,是第5章],以及我在 这篇论文 中给出的图的来源。
解决方案
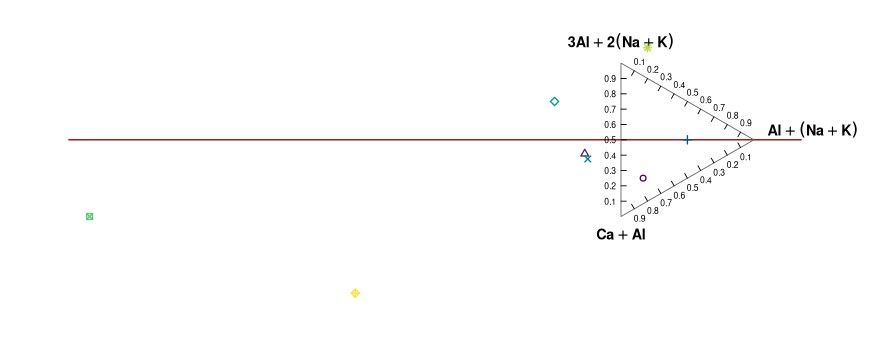
你可以使用基础绘图(base graphics),定义一个绘制坐标轴的函数。
axis_edge <- \(a, b, at=1:9*.1, len=0.035, side=1, cex=NULL, labs=TRUE) {
  if (is.null(cex)) cex <- par("cex")*.6
  d <- b - a
  d <- d/sqrt(sum(d^2))
  n <- side*c(-d[2], d[1])
  for (t in at) {
    p <- a + t*(b - a)
    segments(p[1], p[2], p[1] - len*n[1], p[2] - len*n[2])
    if (labs) text(p[1] + 2*len*n[1], p[2] + 2*len*n[2], labels=t, cex=cex)
  }
}
例如,像下面这样:
verts <- matrix(c(0, 0, sqrt(3)/2, -0.5, 0, -1), ncol=2, byrow=TRUE)

pad_range <- \(x, pad=0.06) {
  r <- range(x, finite=TRUE)
  r + c(-1, 1)*diff(r)*pad
}

grd <- mapply(pad_range,
              list(c(df$xcoord, verts[, 1]),
                   c(df$ycoord, verts[, 2]),
                   df$xcoord),
              pad=c(0.06, 0.06, 0.03))


op <- par(xpd=TRUE, mar=c(1, 1, 1, 1), cex=1)
plot(NA, xlim=grd[, 1], ylim=grd[, 2], asp=1, axes=FALSE, xlab="", ylab="",
     panel.first={
       segments(grd[1, 3], -0.5, grd[2, 3], -0.5, col="darkred", lwd=1.5)
       polygon(verts[, 1], verts[, 2], border="grey40")
       axis_edge(verts[1, ], verts[2, ], side=1)
       axis_edge(verts[2, ], verts[3, ], side=1)
       axis_edge(verts[3, ], verts[1, ], side=1)
       text(verts[1, 1], verts[1, 2], expression(bold('3'*Al+'2'*(Na+K))), pos=3, offset=0.8)
       text(verts[2, 1], verts[2, 2]*0.9, expression(bold(Al + (Na + K))), pos=4, offset=0.8)
       text(verts[3, 1], verts[3, 2], expression(bold(Ca + Al)), pos=1, offset=0.8)
     })
clr <- hcl.colors(nrow(df))
points(df$xcoord, df$ycoord, cex=0.9, pch=df$foo, lwd=1.5,
       col=clr[df$foo], bg=clr[df$foo])
par(op)
数据:
数据:
> dput(df)
structure(list(aa = c(1, -6, 1, 2, -4, -2, 5, 1, -3), bb = c(1,
3, 2, -1, 2, 4, 1, -4, 6), cc = c(4, -8, 1, 3, -2, -3, -1, 5,
2), foo = c(1L, 2L, 3L, 4L, 5L, 7L, 8L, 9L, 10L), sum = c(6,
-11, 4, 4, -4, -1, 5, 2, 5), aa_s = c(0.166666666666667, 0.545454545454545,
0.25, 0.5, 1, 2, 1, 0.5, -0.6), bb_s = c(0.166666666666667, -0.272727272727273,
0.5, -0.25, -0.5, -4, 0.2, -2, 1.2), cc_s = c(0.666666666666667,
0.727272727272727, 0.25, 0.75, 0.5, 3, -0.2, 2.5, 0.4), xcoord = c(0.144337567297406,
-0.236188746486665, 0.433012701892219, -0.21650635094611, -0.433012701892219,
-3.46410161513775, 0.173205080756888, -1.73205080756888, 1.03923048454133
), ycoord = c(-0.75, -0.590909090909091, -0.5, -0.625, -0.25,
-1, 0.1, -1.5, -1)), row.names = c(1L, 2L, 3L, 4L, 5L, 7L, 8L,
9L, 10L), class = "data.frame")
相关文章





