


Plotly的 rangeslider小部件在显示所选范围时,无法同时显示整个数据集
我想创建一个Shiny应用,用来显示时间序列数据,包含若干选择器和一个日期范围输入控件。此外,我还希望在使用绘图底部的范围滑块时,相应地更新日期范围输入控件。以下代码正在处理这一切:
library(shiny)
library(plotly)

xls_plot <- structure(list(mid_date = structure(c(20106,
20106, 20113, 20113, 20120, 20120, 20127, 20127, 20134, 20134,
20141, 20141, 20148, 20148, 20155, 20155, 20162, 20162, 20169,
20169, 20176, 20176, 20183, 20183, 20190, 20190, 20197, 20197,
20204, 20204, 20211, 20211, 20218, 20218, 20225, 20225, 20232,
20232, 20239, 20239, 20246, 20246, 20253, 20253, 20260, 20260,
20267, 20267, 20274, 20274, 20281, 20281, 20288, 20288, 20295,
20295, 20302, 20302, 20309, 20309, 20316, 20316, 20323, 20323,
20330, 20330, 20337, 20337, 20344, 20344, 20351, 20351, 20358,
20358, 20365, 20365, 20372, 20372, 20379, 20379, 20386, 20386,
20393, 20393, 20400, 20400, 20407, 20407, 20414, 20414, 20421,
20421, 20428, 20428, 20435, 20435), class = "Date"), concentration = c(1.39, 1.45, 0.69, 0.87, 1.29,
1.35, 1.48, 1.46, 1.3, 1.37, 0.1, 0.1, 1.53, 1.39, 1.58, 1.76,
0.82, 0.84, 1.28, 1.05, 1.13, 1.11, 0.99, 0.96, 0.37, 0.42, 0.42,
0.35, 0.41, 0.56, 0.51, 0.42, 0.33, 0.51, 0.39, 0.34, 0.22, 0.25,
0.22, 0.28, 0.25, 0.27, 0.44, 0.52, 0.15, 0.24, 0.17, 0.12, 0.13,
0.13, 0.15, 0.31, 0.11, 0.1, 0.18, 0.1, 0.1, 0.1, 0.23, 0.24,
0.27, 1.06, 0.15, 0.1, 0.13, 1.06, 0.16, 0.11, 0.18, 0.27, 0.27,
0.33, 0.49, 0.49, 0.1, 0.37, 0.38, 0.44, 0.36, 0.36, 0.23, 0.22,
0.32, 0.25, 0.36, 0.42, 0.48, 0.59, 0.1, 0.42, 0.1, 0.33, 1.08,
0.26, 0.49, 0.45)), row.names = c(NA, -96L), class = c("tbl_df",
"tbl", "data.frame")) %>%
  mutate(pollutant = "B", station = "51R001") %>%
  group_by(station, pollutant) %>%
  mutate(index = factor(dplyr::cur_group_id()))


stations <- unique(xls_plot$station)
pollutants <- unique(xls_plot$pollutant)
start_date <- min(xls_plot$mid_date)
end_date <- max(xls_plot$mid_date)

ui <- fluidPage(
  sidebarLayout(
    sidebarPanel(
      selectizeInput(
        inputId = "stations",
        label = "Station",
        choices = c("", stations),
        multiple = TRUE
      ),
      selectizeInput(
        inputId = "pollutants",
        label = "Polluant",
        choices = c("", pollutants),
        multiple = FALSE
      ),
      dateRangeInput(
        inputId = "dates",
        label = "Dates",
        start = start_date,
        end = end_date,
        min = NULL,
        max = NULL,
        format = "dd/mm/yyyy",
        startview = "month",
        weekstart = 1,
        language = "fr",
        separator = " à ",
        width = NULL,
        autoclose = TRUE
      ),
      width = 2),
    # Show a plot of the generated distribution
    mainPanel(
      plotlyOutput(outputId = "plot"),
      width = 10)
  )
)

xls_plot_filtered <- NULL
xmin_filtered <- NULL
xmax_filtered <- NULL
yRange <- NULL
server <- function(input, output, session, ...) {
  reactivedata <- reactive({
    xls_plot_filtered <<- xls_plot %>%
      filter(station %in% input$stations) %>%
      filter(pollutant %in% input$pollutants)

    xmin_filtered <<- min(xls_plot_filtered$mid_date)
    xmax_filtered <<- max(xls_plot_filtered$mid_date)
    yRange <<- range(xls_plot_filtered$concentration, na.rm = TRUE)

    if (all(!is.null(req(input$dates))))
      xls_plot_filtered %>% filter(mid_date>=input$dates[1] & mid_date<input$dates[2])
    else
      xls_plot_filtered
  })

  output$plot <- renderPlotly({
    req(input$stations, input$pollutants)
    if (identical(input$stations, "") || identical(input$pollutants, "")) return(NULL)

    xls_plot_filtered <<- reactivedata()

    plot_ly(xls_plot_filtered, x = ~mid_date, y = ~concentration, showlegend = FALSE) %>%
      add_bars(color = ~index) %>%
      rangeslider() %>%
      layout(
        barmode = "stack",
        title = "COV",
        xaxis = list(
          title = "Date",
          rangeslider = list(type = "date")),
        yaxis = list(title = "Concentration [µg/m³]", showline = TRUE),
        legend = list(itemclick = FALSE, itemdoubleclick = FALSE))
  })

  observeEvent(event_data("plotly_relayout"), {
    d <- event_data("plotly_relayout")
    xmin <- if (length(d[["xaxis.range[0]"]])) d[["xaxis.range[0]"]] else d[["xaxis.range"]][1]
    xmax <- if (length(d[["xaxis.range[1]"]])) d[["xaxis.range[1]"]] else d[["xaxis.range"]][2]
    if (is.null(xmin) || is.null(xmax)) return(NULL)

    # compute the y-range based on the new x-range
    idx <- with(xls_plot_filtered, xmin <= mid_date & mid_date <= xmax)
    yrng <- extendrange(xls_plot_filtered$concentration[idx])
    yrng[0] <- 0.

    # Update daterange selector accordingly to selection
    updateDateRangeInput(session, "dates", label = NULL, start = xmin,
                         end = xmax, min = NULL, max = NULL)

    plotlyProxy("plot", session) %>%
      plotlyProxyInvoke("relayout", list(yaxis = list(range = yrng)))
  })

  observeEvent(event_data("plotly_doubleclick"), {
    # Update daterange selector accordingly to selection
    updateDateRangeInput(session, "dates", label = NULL, start = xmin_filtered,
                         end = xmax_filtered, min = NULL, max = NULL)

    plotlyProxy("plot", session) %>%
      plotlyProxyInvoke("relayout", list(yaxis = list(range = yRange)))
  })
}

app <- shinyApp(ui, server)
然而,用于更新输入日期范围控件的observeEvent代码会导致rangeslider小部件无法显示数据的完整范围,而只显示所选的窗口: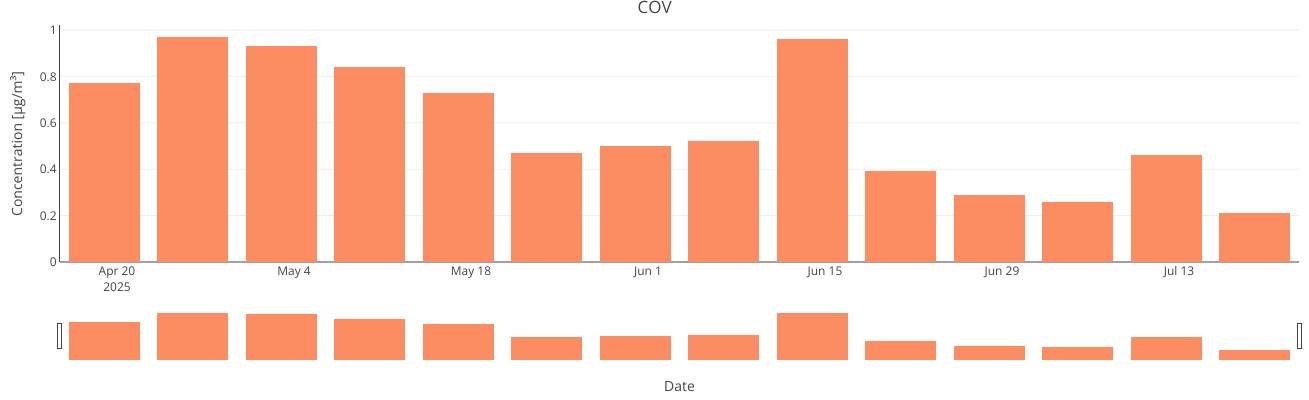
而它被正确显示为:
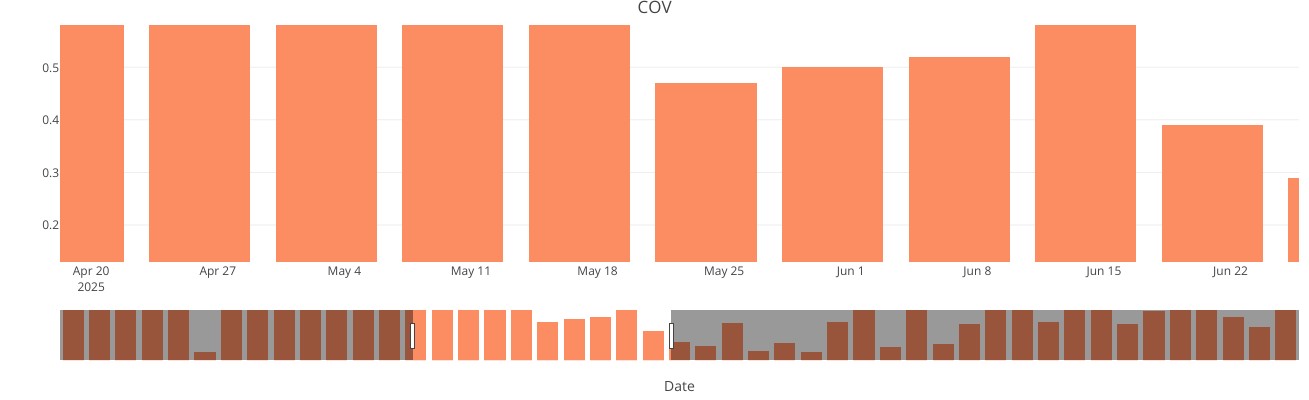
如果把下面的代码注释掉
updateDateRangeInput(session, "dates", label = NULL, start = xmin,
                         end = xmax, min = NULL, max = NULL)
在仍然更新输入日期范围控件的前提下,如何修改我的代码以让它重新正常工作?谢谢
解决方案
如果你有两个Shiny输入可以相互更新,除非这两个值彼此同构,否则改变其中一个输入将导致无限循环。 这个演示通过在短时间内“禁用”另一个输入来处理这种情况。1
你可以将这个很棒的演示从 @tomjemmett 改编到你的用例中,以便 dateRangeInput 和 plotly_relayout 能够安全地互相更新。为清晰起见,界面进行了简化。
# R 4.6.0
library(shiny)  # shiny_1.13.0
library(plotly) # plotly_4.12.0

input_data <- structure(list(mid_date = structure(c(20106, 20106, 20113, 20113, 20120, 20120, 20127, 20127, 20134, 20134, 20141, 20141, 20148, 20148, 20155, 20155, 20162, 20162, 20169, 20169, 20176, 20176, 20183, 20183, 20190, 20190, 20197, 20197, 20204, 20204, 20211, 20211, 20218, 20218, 20225, 20225, 20232, 20232, 20239, 20239, 20246, 20246, 20253, 20253, 20260, 20260, 20267, 20267, 20274, 20274, 20281, 20281, 20288, 20288, 20295, 20295, 20302, 20302, 20309, 20309, 20316, 20316, 20323, 20323, 20330, 20330, 20337, 20337, 20344, 20344, 20351, 20351, 20358, 20358, 20365, 20365, 20372, 20372, 20379, 20379, 20386, 20386, 20393, 20393, 20400, 20400, 20407, 20407, 20414, 20414, 20421, 20421, 20428, 20428, 20435, 20435), class = "Date"), concentration = c(1.39, 1.45, 0.69, 0.87, 1.29, 1.35, 1.48, 1.46, 1.3, 1.37, 0.1, 0.1, 1.53, 1.39, 1.58, 1.76, 0.82, 0.84, 1.28, 1.05, 1.13, 1.11, 0.99, 0.96, 0.37, 0.42, 0.42, 0.35, 0.41, 0.56, 0.51, 0.42, 0.33, 0.51, 0.39, 0.34, 0.22, 0.25, 0.22, 0.28, 0.25, 0.27, 0.44, 0.52, 0.15, 0.24, 0.17, 0.12, 0.13, 0.13, 0.15, 0.31, 0.11, 0.1, 0.18, 0.1, 0.1, 0.1, 0.23, 0.24, 0.27, 1.06, 0.15, 0.1, 0.13, 1.06, 0.16, 0.11, 0.18, 0.27, 0.27, 0.33, 0.49, 0.49, 0.1, 0.37, 0.38, 0.44, 0.36, 0.36, 0.23, 0.22, 0.32, 0.25, 0.36, 0.42, 0.48, 0.59, 0.1, 0.42, 0.1, 0.33, 1.08, 0.26, 0.49, 0.45), pollutant = c("B", "B", "B", "B", "B", "B", "B", "B", "B", "B", "B", "B", "B", "B", "B", "B", "B", "B", "B", "B", "B", "B", "B", "B", "B", "B", "B", "B", "B", "B", "B", "B", "B", "B", "B", "B", "B", "B", "B", "B", "B", "B", "B", "B", "B", "B", "B", "B", "B", "B", "B", "B", "B", "B", "B", "B", "B", "B", "B", "B", "B", "B", "B", "B", "B", "B", "B", "B", "B", "B", "B", "B", "B", "B", "B", "B", "B", "B", "B", "B", "B", "B", "B", "B", "B", "B", "B", "B", "B", "B", "B", "B", "B", "B", "B", "B"), station = c("51R001", "51R001", "51R001", "51R001", "51R001", "51R001", "51R001", "51R001", "51R001", "51R001", "51R001", "51R001", "51R001", "51R001", "51R001", "51R001", "51R001", "51R001", "51R001", "51R001", "51R001", "51R001", "51R001", "51R001", "51R001", "51R001", "51R001", "51R001", "51R001", "51R001", "51R001", "51R001", "51R001", "51R001", "51R001", "51R001", "51R001", "51R001", "51R001", "51R001", "51R001", "51R001", "51R001", "51R001", "51R001", "51R001", "51R001", "51R001", "51R001", "51R001", "51R001", "51R001", "51R001", "51R001", "51R001", "51R001", "51R001", "51R001", "51R001", "51R001", "51R001", "51R001", "51R001", "51R001", "51R001", "51R001", "51R001", "51R001", "51R001", "51R001", "51R001", "51R001", "51R001", "51R001", "51R001", "51R001", "51R001", "51R001", "51R001", "51R001", "51R001", "51R001", "51R001", "51R001", "51R001", "51R001", "51R001", "51R001", "51R001", "51R001", "51R001", "51R001", "51R001", "51R001", "51R001", "51R001"), index = structure(c(1L, 1L, 1L, 1L, 1L, 1L, 1L, 1L, 1L, 1L, 1L, 1L, 1L, 1L, 1L, 1L, 1L, 1L, 1L, 1L, 1L, 1L, 1L, 1L, 1L, 1L, 1L, 1L, 1L, 1L, 1L, 1L, 1L, 1L, 1L, 1L, 1L, 1L, 1L, 1L, 1L, 1L, 1L, 1L, 1L, 1L, 1L, 1L, 1L, 1L, 1L, 1L, 1L, 1L, 1L, 1L, 1L, 1L, 1L, 1L, 1L, 1L, 1L, 1L, 1L, 1L, 1L, 1L, 1L, 1L, 1L, 1L, 1L, 1L, 1L, 1L, 1L, 1L, 1L, 1L, 1L, 1L, 1L, 1L, 1L, 1L, 1L, 1L, 1L, 1L, 1L, 1L, 1L, 1L, 1L, 1L), levels = "1", class = "factor")), groups = structure(list( station = "51R001", pollutant = "B", .rows = structure(list( 1:96), ptype = integer(0), class = c("vctrs_list_of", "vctrs_vctr", "list"))), row.names = c(NA, -1L), class = c("tbl_df", "tbl", "data.frame"), .drop = TRUE), row.names = c(NA, -96L), class = c("grouped_df", "tbl_df", "tbl", "data.frame"))

ui <- fluidPage(
    dateRangeInput(
      inputId = "dates",
      label = "Dates",
      start = min(input_data$mid_date),
      end = max(input_data$mid_date),
      format = "dd/mm/yyyy",
      weekstart = 1,
      separator = " - "
    ),
    plotlyOutput(outputId = "plotly")
)

server <- function(input, output, session, ...) {

  output$plotly <- renderPlotly({
    plot_ly(
      input_data,
      x = ~ mid_date,
      y = ~ concentration,
      showlegend = FALSE
    ) |>
      add_bars(color = ~ index) |>
      rangeslider() |>
      layout(
        barmode = "stack",
        xaxis = list(title = "Date", rangeslider = list(type = "date")),
        yaxis = list(title = "Concentration [µg/m³]", showline = TRUE),
        legend = list(itemclick = FALSE, itemdoubleclick = FALSE)
      )
  })

  # wrap event_data once so we can bindEvent to it like a normal input
  relayout_data <- reactive(event_data("plotly_relayout"))

  # keep track of whether we are allowed to update the inputs. Default both to TRUE
  allow_update <- reactiveValues(dates = TRUE, plot = TRUE)

  # create reactives that will fire when the input's change. They will return
  # * NULL, if this slider cannot be updated currently
  # * The current system time otherwise (a monotonically increasing value)
  update_plot  <- reactive(if (allow_update$plot)  Sys.time()) |>
    bindEvent(relayout_data())

  update_dates <- reactive(if (allow_update$dates) Sys.time()) |>
    bindEvent(input$dates)

  # observe the event of these update_*() reactives changing. We need to make sure to not
  # bind to the event when on initialisation, otherwise we will get stuck in a loop
  # plotly updates dateRangeInput
  observe({
    d <- relayout_data()

    new_start <- d[["xaxis.range"]][1] |> as.Date()
    new_end <- d[["xaxis.range"]][2] |> as.Date()

    if (is.null(new_start) || is.null(new_end)) return()

    allow_update$dates <- FALSE
    updateDateRangeInput(session, "dates", start = new_start, end = new_end)
  }) |>
    bindEvent(update_plot(), ignoreInit = TRUE)

  # dateRangeInput updates plotly
  observe({
    allow_update$plot <- FALSE
    plotlyProxy("plotly", session) |>
      plotlyProxyInvoke(
        "relayout",
        list("xaxis.range" = as.character(input$dates))
      )
  }) |>
    bindEvent(update_dates(), ignoreInit = TRUE)

  # in order to re-enabled the inputs, we want to wait a short period of time. create a
  # monotonically increasing reactive which is triggered by the allow_update reactiveValues
  last_update_trigger <- reactive(Sys.time()) |>
    bindEvent(allow_update$dates, allow_update$plot) |>
    debounce(100)

  # when the last_update_trigger is fired, re-enable the inputs
  observe({
    allow_update$plot <- TRUE
    allow_update$dates <- TRUE
  }) |>
    bindEvent(last_update_trigger())
}

shinyApp(ui, server)
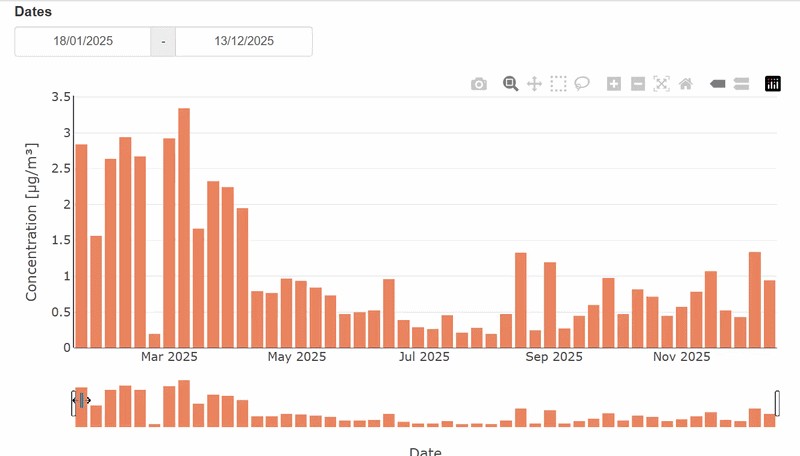
编辑1
我仍然有一个问题:当发生relayout事件(通过rangeslider、日期范围输入或选择)时,如何根据所选数据来改变y 轴的范围?
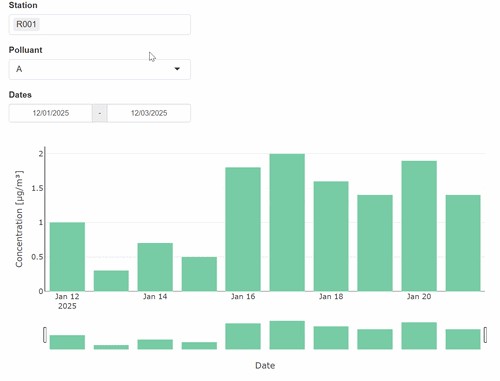
--> 你可以通过对 yaxis.range 进行Plotly的重新布局来改变y 轴范围。但就你给出的示例而言,我不会让y 轴成为可变的。我只需要重新绘制,并在output$plotly内使用输入,让Plotly选择合适的范围,像这样:
# R 4.6.0
library(shiny)  # shiny_1.13.0
library(plotly) # plotly_4.12.0

set.seed(42321)
input_data <- data.frame(
  station       = rep(c("R001", "R002", "R003"), each = 20),
  pollutant     = rep(rep(c("A", "B"), each = 10), 3),
  mid_date      = seq.Date(20100, 20159),
  concentration = sample(20, 60, replace = TRUE) / 10
) |>
  within({
    index = match(paste(station, pollutant), unique(paste(station, pollutant)))
    concentration = index * concentration
    index = factor(index)
    })

ui <- fluidPage(
    selectizeInput(
      inputId = "stations",
      label = "Station",
      selected = input_data$station[1],
      choices = unique(input_data$station),
      multiple = TRUE
    ),
    selectizeInput(
      inputId = "pollutants",
      label = "Polluant",
      choices = unique(input_data$pollutant),
      multiple = FALSE
    ),
    dateRangeInput(
      inputId = "dates",
      label = "Dates",
      start = min(input_data$mid_date),
      end = max(input_data$mid_date),
      format = "dd/mm/yyyy",
      weekstart = 1,
      separator = " - "
    ),
    plotlyOutput(outputId = "plotly")
)

server <- function(input, output, session, ...) {

  output$plotly <- renderPlotly({
    req(input$stations, input$pollutants)

    input_data |>
      filter(station %in% input$stations) |>
      filter(pollutant %in% input$pollutants) |>
      plot_ly(
        x = ~ mid_date,
        y = ~ concentration,
        showlegend = FALSE
      ) |>
        add_bars(color = ~index) |>
        rangeslider() |>
        layout(
          barmode = "stack",
          xaxis = list(title = "Date", rangeslider = list(type = "date")),
          yaxis = list(title = "Concentration [µg/m³]", showline = TRUE),
          legend = list(itemclick = FALSE, itemdoubleclick = FALSE)
        )
  })

  # wrap event_data once so we can bindEvent to it like a normal input
  # for multiple plotly-plots you might need to set the source which defaults to A
  relayout_data <- reactive(event_data("plotly_relayout"))

  # keep track of whether we are allowed to update the inputs. Default both to TRUE
  allow_update <- reactiveValues(dates = TRUE, plot = TRUE)

  # create reactives that will fire when the input's change. They will return
  # * NULL, if this slider cannot be updated currently
  # * The current system time otherwise (a monotonically increasing value)
  update_plot  <- reactive(if (allow_update$plot)  Sys.time()) |>
    bindEvent(input$`plotly_relayout-A`)

  update_dates <- reactive(if (allow_update$dates) Sys.time()) |>
    bindEvent(input$dates)

  # observe the event of these update_*() reactives changing. We need to make sure to not bind to the event when on
  # initialisation, otherwise we will get stuck in a loop
  # plotly updates dateRangeInput
  observe({
    d <- relayout_data()

    new_start <- d[["xaxis.range"]][1] |> as.Date()
    new_end <- d[["xaxis.range"]][2] |> as.Date()

    if (is.null(new_start) || is.null(new_end)) return()

    allow_update$dates <- FALSE
    updateDateRangeInput(session, "dates", start = new_start, end = new_end)
  }) |>
    bindEvent(update_plot(), ignoreInit = TRUE)

  # dateRangeInput updates plotly
  observe({
    allow_update$plot <- FALSE
    plotlyProxy("plotly", session) |>
      plotlyProxyInvoke(
        "relayout",
        list("xaxis.range" = as.character(input$dates))
      )
  }) |>
    bindEvent(update_dates(), ignoreInit = TRUE)

  # in order to re-enabled the inputs, we want to wait a short period of time. create a monotonically increasing
  # reactive which is triggered by the allow_update reactiveValues
  last_update_trigger <- reactive(Sys.time()) |>
    bindEvent(allow_update$dates, allow_update$plot) |>
    debounce(100)

  # when the last_update_trigger is fired, re-enable the inputs
  observe({
    allow_update$plot <- TRUE
    allow_update$dates <- TRUE
  }) |>
    bindEvent(last_update_trigger())
}

shinyApp(ui, server)
站内所有文章版权归属LeftHeroAI导航站,无授权禁止任何主体转载、抄袭、复制内容,亦不得私自架设镜像站点。一经侵权,本站将通过法律途径追责。
相关文章






汇集全球数千款 AI 工具,每日持续更新,配套 AI 开发学习资源,轻松用 AI 提升工作效率。快捷键 Ctrl+D/⌘+D 一键收藏本站。