


添加带箭头的曲线
我用Plotly绘制了一张带曲线的图。通过使用shapes和贝塞尔曲线,我设法把它们加进来。箭头应该在贝塞尔曲线末端的方向上“自然地”指向曲线的方向。
下面给出一个完整的可运行示例,其中包含一种较简单的添加箭头的方法:
import plotly.graph_objects as go
import numpy as np

fig = go.Figure()

u1 = (1, 1)
u2 = (5, 2)
q = (2.5, 3.5)

# bezier curve
fig.add_shape(
    type="path",
    #path=f"M 4,4 Q 50,150 100,100",
    path=f"M {u1[0]},{u1[1]} Q {q[0]},{q[1]} {u2[0]},{u2[1]}",
    line = dict(
        color="red",
        width=2
    )
)

# 'arrow'
# Naive computation of the arrow and its direction using the vector
# u of the direct line between u1 and u2.
# Ideally the direction of u should be used of the tangent of the bezier-curve
# at point u2.
u = np.subtract(u2, u1)
un = u / np.linalg.norm(u)
v = np.asarray((-1 * u[1], u[0]))
vn = v / np.linalg.norm(v)
a0 = u2 - 0.5 * un
a1 = a0 + 0.2 * vn
a2 = a0 - 0.2 * vn

fig.add_shape(
    type="path",
    #path=f"M 4,4 Q 50,150 100,100",
    path=f"M {u2[0]},{u2[1]} L {a1[0]},{a1[1]} L {a2[0]},{a2[1]} L {u2[0]},{u2[1]}",
   # fillcolor='green',
    line = dict(
        color="green",
        width=2,
    )
)
结果如下图所示:
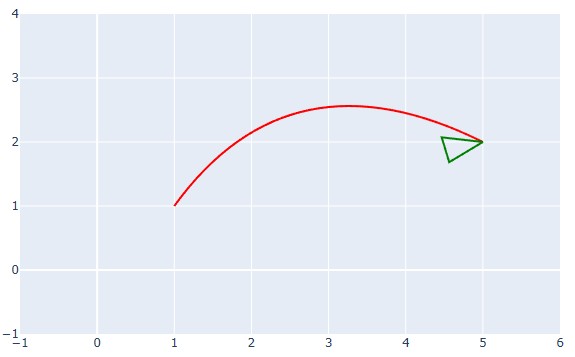
我使用的箭头指向向量u2的方向,但箭头的方向显然并未与贝塞尔曲线对齐。理想情况下,我希望使用贝塞尔曲线的斜率来确定箭头的方向。
有什么想法或建议来实现一个解决方案?
解决方案
你的用切线的思路看起来没问题,但你用的数值是错的:
它必须是 np.subtract(u2, q)(用 q 代替 u1)
另一端为 np.substract(q, u1)
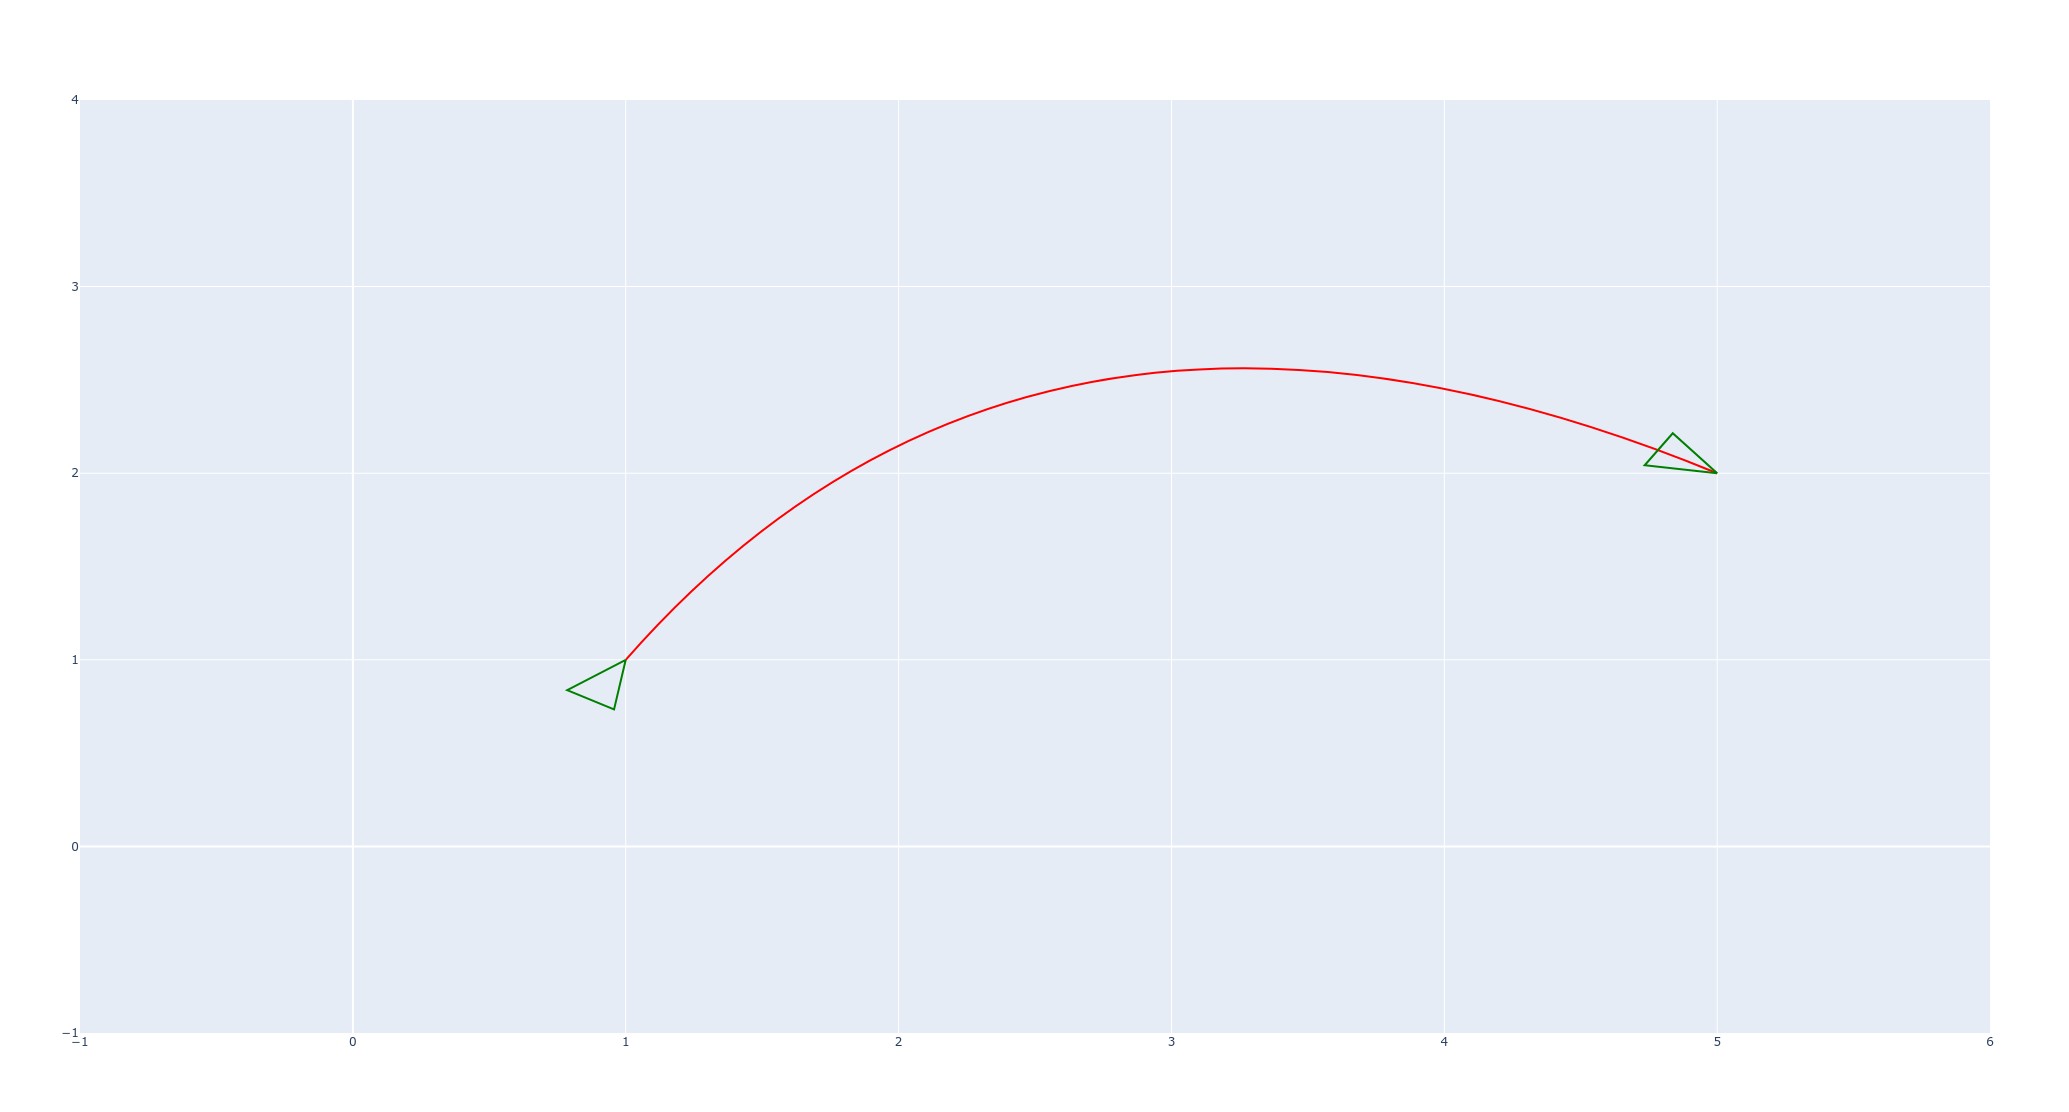
带有相反箭头方向的完整代码。
import plotly.graph_objects as go
import numpy as np


fig = go.Figure()

u1 = (1, 1)
u2 = (5, 2)
q = (2.5, 3.5)

# bezier curve
fig.add_shape(
    type="path",
    # path=f"M 4,4 Q 50,150 100,100",
    path=f"M {u1[0]},{u1[1]} Q {q[0]},{q[1]} {u2[0]},{u2[1]}",
    line=dict(color="red", width=2),
)

# 'arrow'
# Naive computation of the arrow and its direction using the vector
# u of the direct line between u1 and u2.
# Ideally the direction of u should be used of the tangent of the bezier-curve
# at point u2.

u = np.subtract(u2, q)  # <--- q

un = u / np.linalg.norm(u)
v = np.asarray((-u[1], u[0]))


vn = v / np.linalg.norm(v)
a0 = u2 - 0.25 * un
a1 = a0 + 0.1 * vn
a2 = a0 - 0.1 * vn

fig.add_shape(
    type="path",
    # path=f"M 4,4 Q 50,150 100,100",
    path=f"M {u2[0]},{u2[1]} L {a1[0]},{a1[1]} L {a2[0]},{a2[1]} L {u2[0]},{u2[1]}",
    # fillcolor='green',
    line=dict(
        color="green",
        width=2,
    ),
)

# --- other end with opposite direction

u = np.subtract(q, u1)  # <--- q

un = u / np.linalg.norm(u)
v = np.asarray((-u[1], u[0]))

vn = v / np.linalg.norm(v)
a0 = u1 + 0.25 * un    # <--- plus
a1 = a0 - 0.1 * vn     # <--- minus
a2 = a0 + 0.1 * vn     # <--- plus

fig.add_shape(
    type="path",
    # path=f"M 4,4 Q 50,150 100,100",
    path=f"M {u1[0]},{u1[1]} L {a1[0]},{a1[1]} L {a2[0]},{a2[1]} L {u1[0]},{u1[1]}",
    # fillcolor='green',
    line=dict(
        color="green",
        width=2,
    ),
)

fig.show()
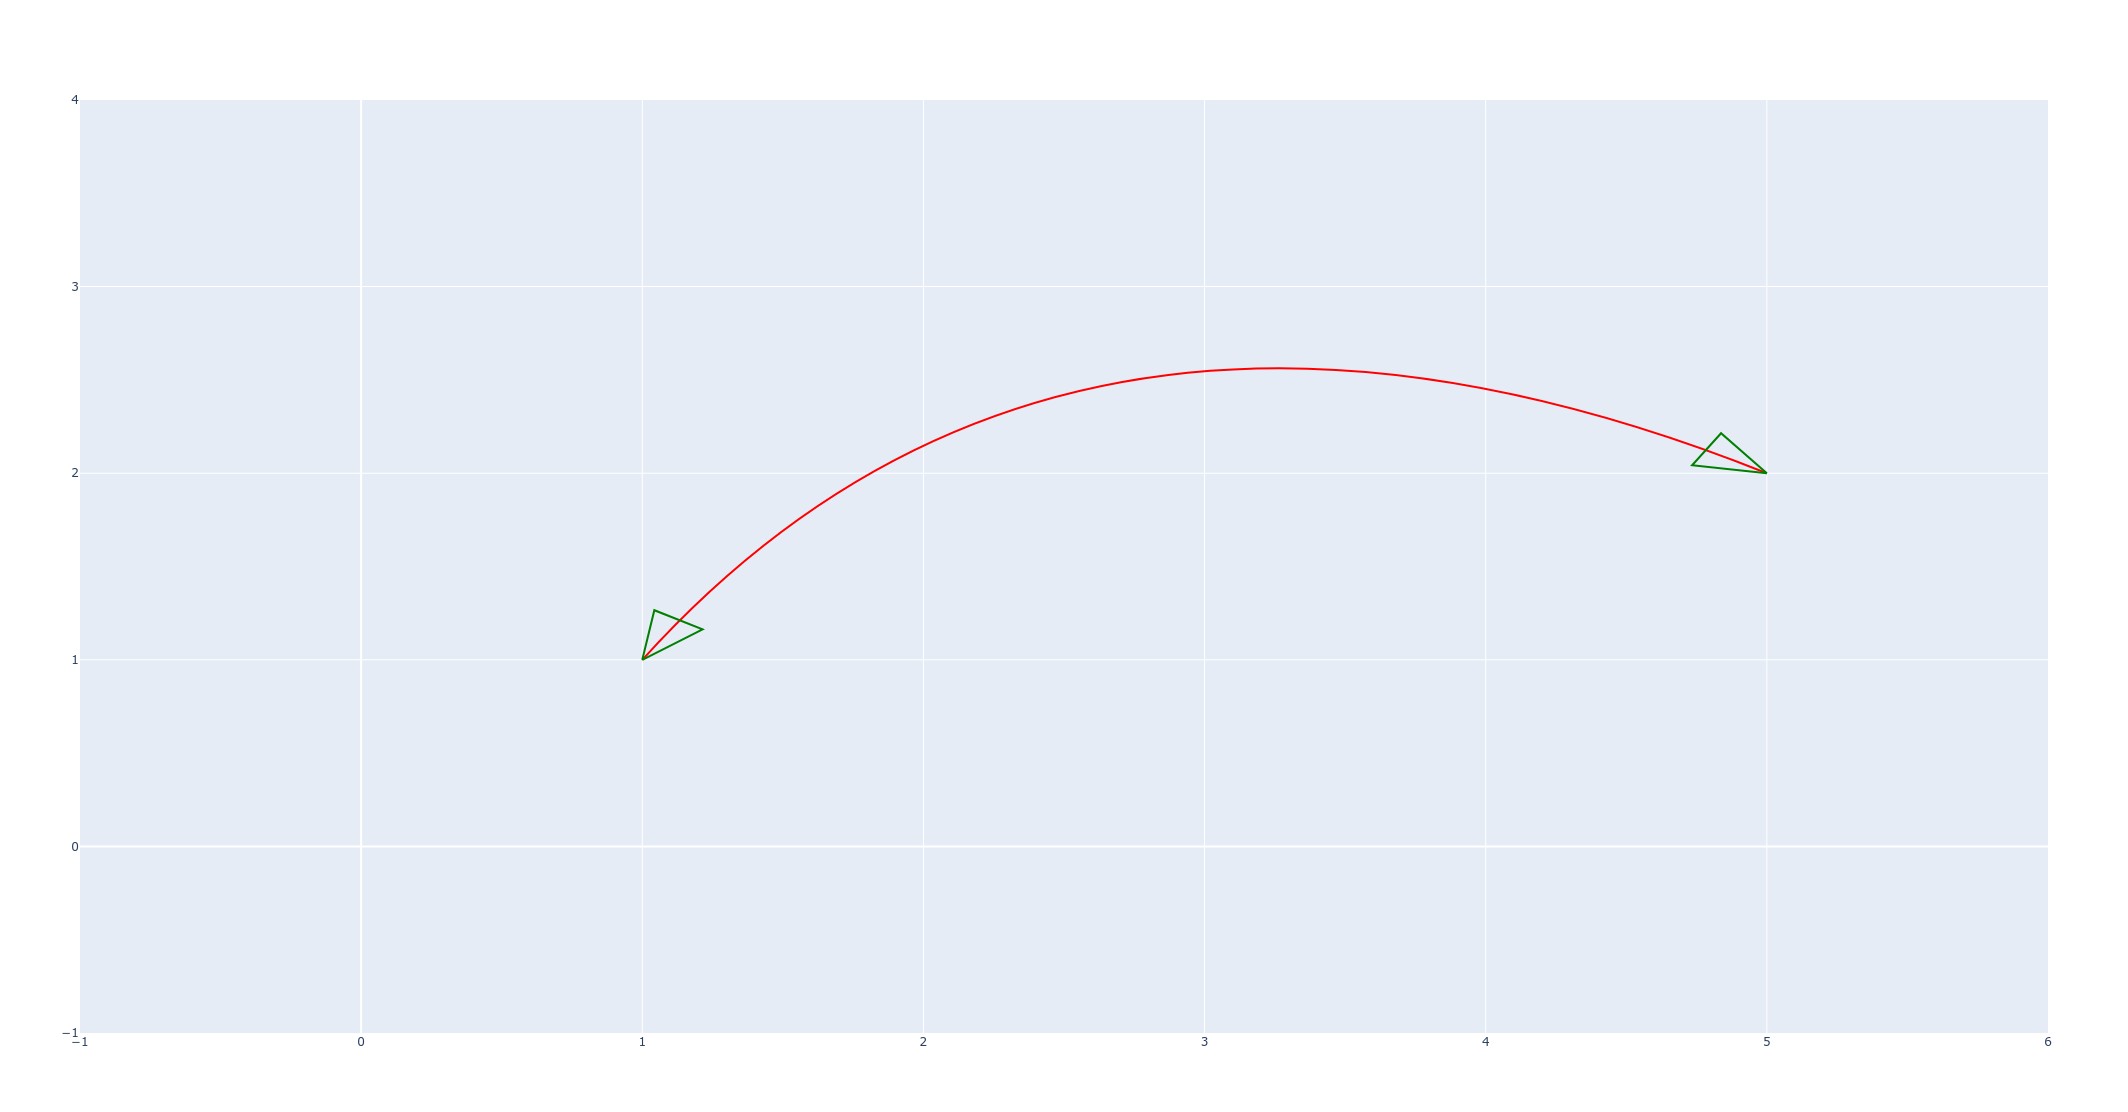
我认为通过贝塞尔曲线的公式及其导数的公式,你可以计算曲线上任意点的位置和切向量。
(维基百科上的公式:Bézier curve)
站内所有文章版权归属LeftHeroAI导航站,无授权禁止任何主体转载、抄袭、复制内容,亦不得私自架设镜像站点。一经侵权,本站将通过法律途径追责。
相关文章






汇集全球数千款 AI 工具,每日持续更新,配套 AI 开发学习资源,轻松用 AI 提升工作效率。快捷键 Ctrl+D/⌘+D 一键收藏本站。