


在rayshader中自定义比例尺颜色以匹配地图调色板
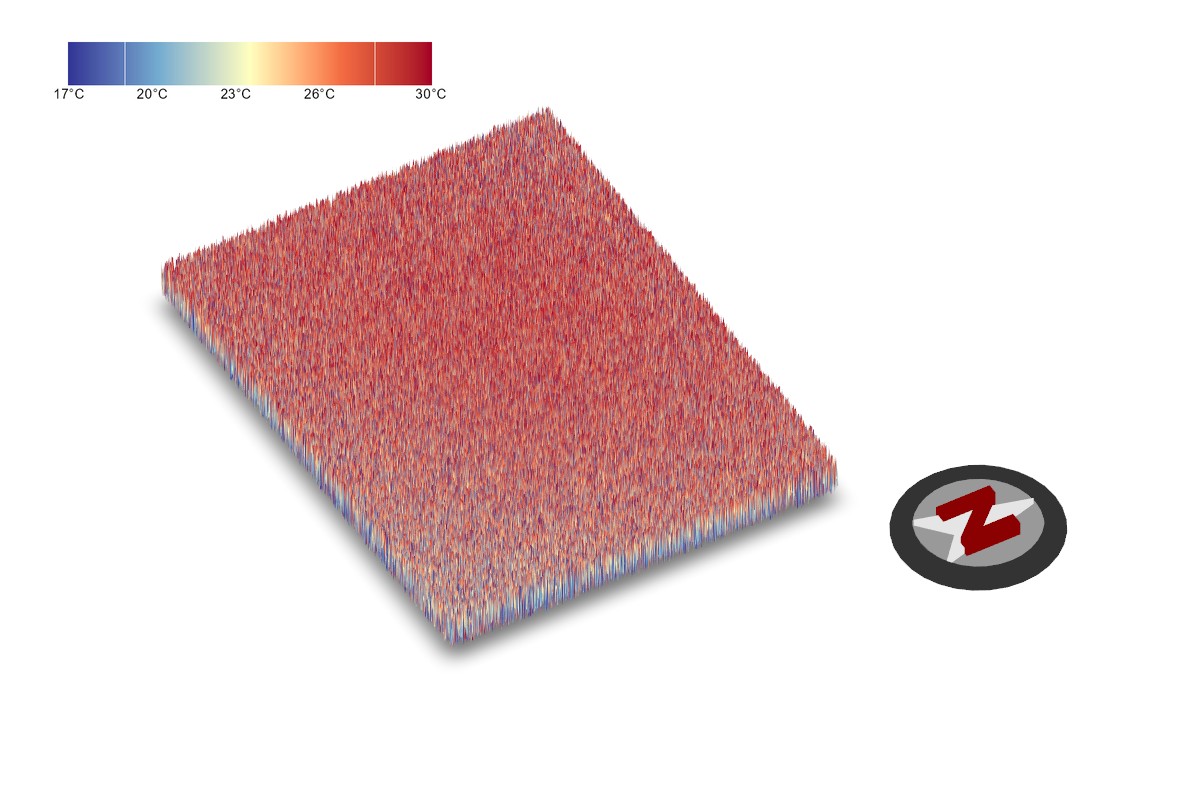
我正在使用R 的rayshader在伦敦创建一个地表温度(LST)的三维地图。该地图使用分歧型RdYlBu调色板(c("#313695", "#74add1", "#ffffbf", "#f46d43", "#a50026")),但 render_scalebar() 函数只接受两种颜色(color_first 和 color_second),导致出现交替的两色条纹,无法反映地图的调色板。
以下是我当前的代码:
pacman::p_load(terra, rayshader)

# 1. Load the raster
lst_rast <- rast(
  nrows = 562,
  ncols = 729,
  resolution = c(80, 80),
  extent = ext(503580, 561900, 155920, 200880),
  crs = "EPSG:27700"
)

values(lst_rast) <- runif(562 * 729, min = 17, max = 30)
names(lst_rast) <- "london_study_area"

# 2. Convert to matrix
lst_matrix <- raster_to_matrix(raster::raster(lst_rast))

range(lst_matrix, na.rm = TRUE)

# 3. Build shading texture
lst_matrix |>
  height_shade(texture = grDevices::colorRampPalette(
    c("#313695", "#74add1", "#ffffbf", "#f46d43", "#a50026")
  )(256)) |>
  plot_3d(
    lst_matrix,
    zscale     = 0.2,
    theta      = 30,
    phi        = 45,
    zoom       = 0.75,
    windowsize = c(1200, 800),
    background = "white",
    solid      = FALSE
  )

render_camera(fov = 0, theta = 60, zoom = 0.75, phi = 45)
render_scalebar(
  limits       = c(0, 5, 10),
  label_unit   = "km",
  position     = "W",
  scale_length = c(0.33, 1)
)
render_compass(position = "NE")
render_snapshot(clear = TRUE)
有没有办法将完整的颜色渐变应用到 render_scalebar()?
> sessionInfo()
R version 4.5.3 (2026-03-11 ucrt)
Platform: x86_64-w64-mingw32/x64
Running under: Windows 11 x64 (build 26200)

Matrix products: default
  LAPACK version 3.12.1

locale:
[1] LC_COLLATE=English_United States.utf8  LC_CTYPE=English_United States.utf8    LC_MONETARY=English_United States.utf8
[4] LC_NUMERIC=C                           LC_TIME=English_United States.utf8

time zone: Europe/Budapest
tzcode source: internal

attached base packages:
[1] stats     graphics  grDevices utils     datasets  methods   base

other attached packages:
[1] terra_1.9-1      rayshader_0.37.3 sf_1.1-0

loaded via a namespace (and not attached):
 [1] class_7.3-23       KernSmooth_2.23-26 lattice_0.22-9     extrafontdb_1.1    hms_1.1.4          digest_0.6.39
 [7] magrittr_2.0.4     rgl_1.3.36         evaluate_1.0.5     grid_4.5.3         iterators_1.0.14   fastmap_1.2.0
[13] foreach_1.5.2      doParallel_1.0.17  jsonlite_2.0.0     processx_3.8.6     progress_1.2.3     pkgbuild_1.4.8
[19] e1071_1.7-17       DBI_1.3.0          ps_1.9.1           codetools_0.2-20   textshaping_1.0.5  cli_3.6.5
[25] rlang_1.1.7        crayon_1.5.3       units_1.0-1        base64enc_0.1-6    remotes_2.5.0      otel_0.2.0
[31] tools_4.5.3        raster_3.6-32      parallel_4.5.3     rayimage_0.15.1    curl_7.0.0         vctrs_0.7.2
[37] R6_2.6.1           png_0.1-9          proxy_0.4-29       lifecycle_1.0.5    classInt_0.4-11    magick_2.9.1
[43] htmlwidgets_1.6.4  ragg_1.5.2         desc_1.4.3         callr_3.7.6        pkgconfig_2.0.3    Rcpp_1.1.1
[49] systemfonts_1.3.2  xfun_0.57          rstudioapi_0.18.0  knitr_1.51         extrafont_0.20     htmltools_0.5.9
[55] Rttf2pt1_1.3.14    compiler_4.5.3     prettyunits_1.2.0  sp_2.2-1
解决方案
跳过使用 render_scalebar() 来创建图例。相反,我们可以将快照保存到一个文件中,使用 {ggplot2} 创建图例,然后将其覆盖在最终图像之上;
render_snapshot("scene.png", clear = TRUE)

library(ggplot2)
library(magick)

legend_plot <- ggplot(data.frame(x = seq(17, 30, length.out = 256),
                                 y = 1),
                      aes(x = x, y = y, fill = x)) +
  geom_tile() +
  scale_fill_gradientn(
    colours = c("#313695", "#74add1", "#ffffbf", "#f46d43", "#a50026")
  ) +
  theme_void() +
  theme(legend.position = "none") +
  scale_x_continuous(breaks = c(17, 20, 23, 26, 30),
                     labels = c("17°C", "20°C", "23°C", "26°C", "30°C"),
                     position = "bottom") +
  theme(axis.text.x = element_text(size = 10, color = "black"),
        axis.ticks.x = element_line(),
        plot.background = element_rect(fill = "white", color = NA))

ggsave("legend.png", legend_plot, width = 4, height = 0.6, dpi = 150)


scene <- image_read("scene.png")
legend <- image_read("legend.png")
legend <- image_resize(legend, geometry_size_pixels(width = 400))

final <- image_composite(scene, legend,
                         offset = "+50+700", gravity = "southwest")
image_write(final, "final_map.png")
站内所有文章版权归属LeftHeroAI导航站,无授权禁止任何主体转载、抄袭、复制内容,亦不得私自架设镜像站点。一经侵权,本站将通过法律途径追责。
相关文章






汇集全球数千款 AI 工具,每日持续更新,配套 AI 开发学习资源,轻松用 AI 提升工作效率。快捷键 Ctrl+D/⌘+D 一键收藏本站。