


生成带有个性化特征的UpSet图
我正在用一个UpSetR来表示五个数据集中共享/私有以及介于两者之间的元素类别。
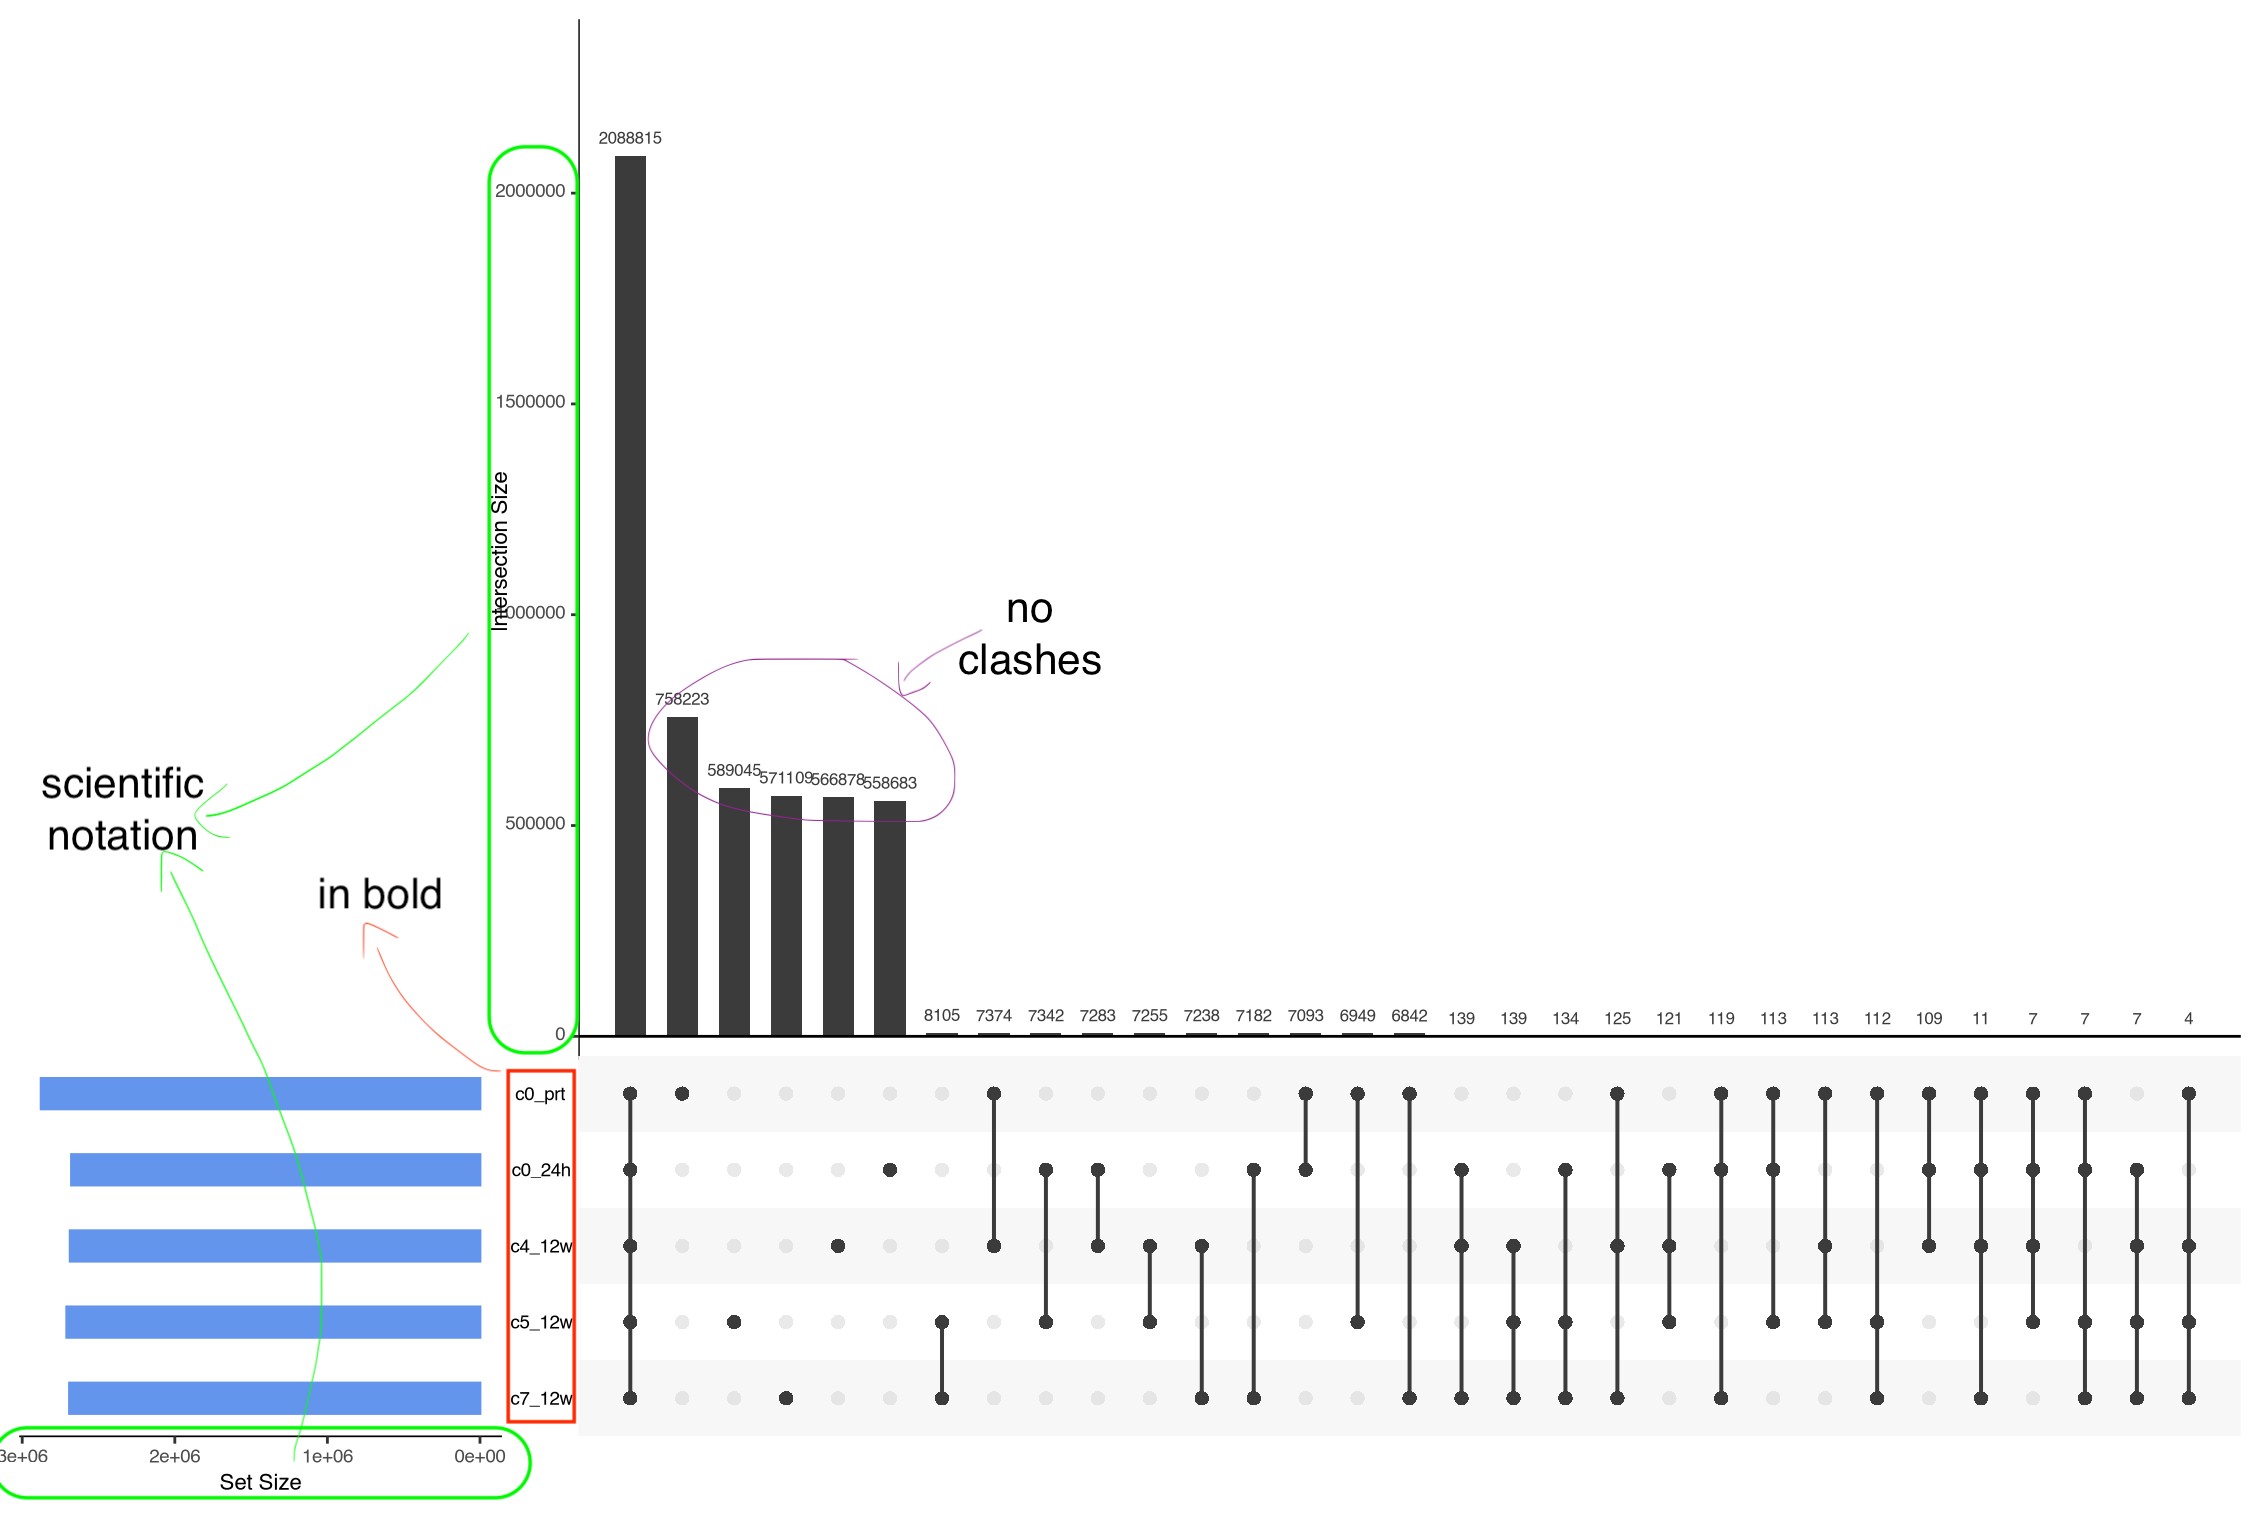
现在,我已经做了一些更基础的工作;不过,如果可能的话,我想增加一些个性化的设置,如下所示:
- 为每个特定类别,避免条形上方数字的重叠
- 将刻度改为科学记数法格式,像
fancy_scientific()那样 - 修改绘图中不同集合的条形和数据点的颜色,如其他回答所示
I've noticed there is a package called ComplexUpset but I didn't quite get how it works (or it didn't in my case...) and couldn't find anywhere how to bold sets' labels.
dput() of combined
combined <- list(c0_prt = c("chr1_2212", "chr1_2608", "chr1_12563", "chr1_12565",
"chr1_17021", "chr1_19962", "chr1_20028", "chr1_24334", "chr1_24343",
"chr1_24437"), c0_24h = c("chr1_2212", "chr1_2608", "chr1_3000",
"chr1_12563", "chr1_15000", "chr1_17021", "chr1_19962", "chr1_21000",
"chr1_24334", "chr1_27000"), c4_12w = c("chr1_2212", "chr1_2608",
"chr1_12563", "chr1_13000", "chr1_14000", "chr1_15000", "chr1_20028",
"chr1_24334", "chr1_24343", "chr1_25000"), c5_12w = c("chr1_2212",
"chr1_2608", "chr1_12563", "chr1_12565", "chr1_14000", "chr1_19962",
"chr1_20028", "chr1_24334", "chr1_24343", "chr1_25000"), c7_12w = c("chr1_2212",
"chr1_2608", "chr1_15000", "chr1_17021", "chr1_19962", "chr1_20028",
"chr1_24334", "chr1_24343", "chr1_24437", "chr1_25000"))
and the code I'm using
library(UpSetR)

###to be used eventually for y-axis scientific notation
fancy_scientific <- function(l) {
  #change weird 0 notations to simply 0
  l <- gsub("^0","0", l)
  # turn in to character string in scientific notation
  l <- format(l, scientific = TRUE)
  # quote the part before the exponent to keep all the digits
  l <- gsub("^(.*)e", "'\\1'e", l)
  # turn the 'e+' into plotmath format
  l <- gsub("e", "%*%10^", l)
  # return this as an expression
  parse(text=l)
}

upsetPlot <- upset(fromList(combined), sets.bar.color = "cornflowerblue", order.by = "freq", keep.order = T, sets = rev(c("c0_prt", "c0_24h", "c4_12w", "c5_12w", "c7_12w")))
upsetPlot
This is the output with notes for the intended modifications
解决方案
{ComplexUpset} seems to have some issues with the new {ggplot2} version and I cannot get it to work.
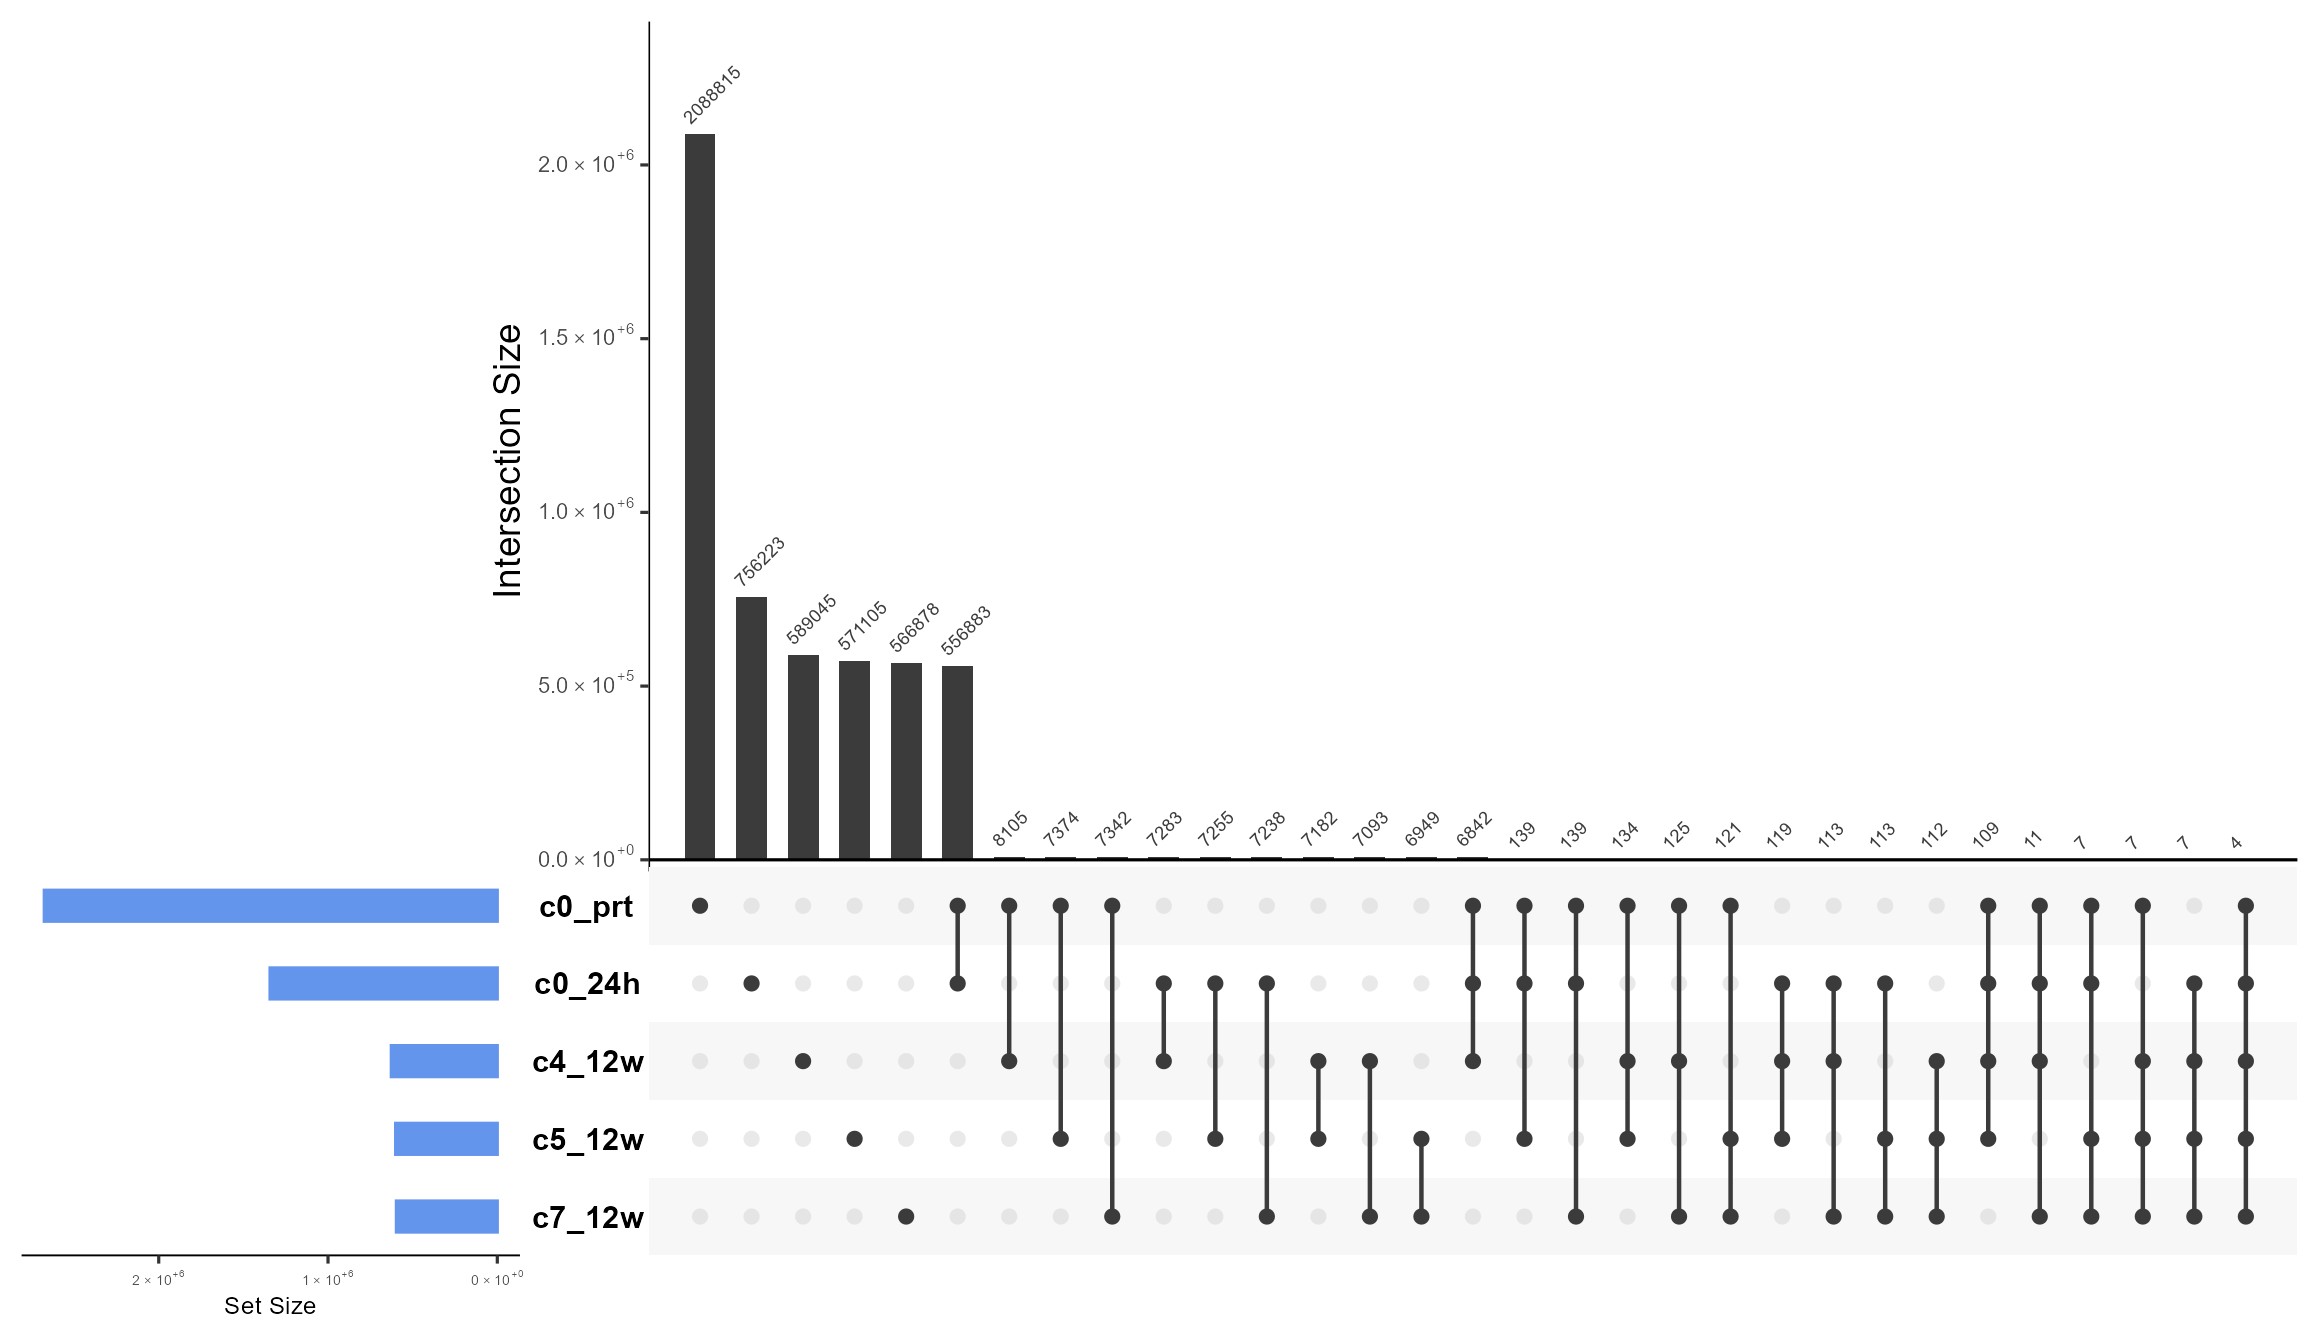
However, we can modify the grobs after creating the plot with{UpSetR}:
library(UpSetR)

p <- upset(fromList(combined),
           sets.bar.color = "cornflowerblue",
           order.by = "freq",
           keep.order = TRUE,
           sets = rev(c("c0_prt", "c0_24h", "c4_12w", "c5_12w", "c7_12w")),
           show.numbers = "yes",
           number.angles = 45, ## rotate the numbers
           text.scale = c(1.5, 1.5, 1, 1, 1.5, 1),
           mb.ratio = c(0.65, 0.35))

## move the numbers to appear on top of each bar
n_bars <- length(p$Main_bar$grobs[[6]]$children[[4]]$label)
p$Main_bar$grobs[[6]]$children[[4]]$hjust <- rep(0, n_bars)

## apply fancy_scientific function and make them a bit smaller
y_axis_text <- p$Main_bar$grobs[[3]]$children[[2]]$grobs[[2]]$children[[1]]
old_labels <- as.numeric(y_axis_text$label)
p$Main_bar$grobs[[3]]$children[[2]]$grobs[[2]]$children[[1]]$label <- fancy_scientific(old_labels)
p$Main_bar$grobs[[3]]$children[[2]]$grobs[[2]]$children[[1]]$gp$cex <- 0.7

## same for Set Size plot
set_size_text <- p$Sizes$grobs[[7]]$children[[2]]$grobs[[2]]$children[[1]]
old_set_labels <- as.numeric(set_size_text$label)
p$Sizes$grobs[[7]]$children[[2]]$grobs[[2]]$children[[1]]$label <- fancy_scientific(old_set_labels)
p$Sizes$grobs[[7]]$children[[2]]$grobs[[2]]$children[[1]]$gp$cex <- 0.7

## bold the set names
for(k in seq_along(p$Matrix$grobs[[3]]$children[[2]]$grobs)) {
  if(inherits(p$Matrix$grobs[[3]]$children[[2]]$grobs[[k]], "titleGrob")) {
    for(m in seq_along(p$Matrix$grobs[[3]]$children[[2]]$grobs[[k]]$children)) {
      if(inherits(p$Matrix$grobs[[3]]$children[[2]]$grobs[[k]]$children[[m]], "text")) {
        p$Matrix$grobs[[3]]$children[[2]]$grobs[[k]]$children[[m]]$gp$font <- NULL
        p$Matrix$grobs[[3]]$children[[2]]$grobs[[k]]$children[[m]]$gp$fontface <- "bold"
      }
    }
  }
}

p
Sample Data:
This is roughly based on the data shared in your plot:
create_upset_data <- function() {
  Sets <- c("c0_prt", "c0_24h", "c4_12w", "c5_12w", "c7_12w")

  intersections <- list(
    list(pattern = c(1,0,0,0,0), count = 2088815),  # c0_prt only
    list(pattern = c(0,1,0,0,0), count = 756223),   # c0_24h only
    list(pattern = c(0,0,1,0,0), count = 589045),   # c4_12w only
    list(pattern = c(0,0,0,1,0), count = 571105),   # c5_12w only
    list(pattern = c(0,0,0,0,1), count = 566878),   # c7_12w only
    list(pattern = c(1,1,0,0,0), count = 556883),   # c0_prt & c0_24h
    list(pattern = c(1,0,1,0,0), count = 8105),     # c0_prt & c4_12w
    list(pattern = c(1,0,0,1,0), count = 7374),     # c0_prt & c5_12w
    list(pattern = c(1,0,0,0,1), count = 7342),     # c0_prt & c7_12w
    list(pattern = c(0,1,1,0,0), count = 7283),     # c0_24h & c4_12w
    list(pattern = c(0,1,0,1,0), count = 7255),     # c0_24h & c5_12w
    list(pattern = c(0,1,0,0,1), count = 7238),     # c0_24h & c7_12w
    list(pattern = c(0,0,1,1,0), count = 7182),     # c4_12w & c5_12w
    list(pattern = c(0,0,1,0,1), count = 7093),     # c4_12w & c7_12w
    list(pattern = c(0,0,0,1,1), count = 6949),     # c5_12w & c7_12w
    list(pattern = c(1,1,1,0,0), count = 6842),     # 3-way
    list(pattern = c(1,1,0,1,0), count = 139),      # 3-way
    list(pattern = c(1,1,0,0,1), count = 139),      # 3-way
    list(pattern = c(1,0,1,1,0), count = 134),      # 3-way
    list(pattern = c(1,0,1,0,1), count = 125),      # 3-way
    list(pattern = c(1,0,0,1,1), count = 121),      # 3-way
    list(pattern = c(0,1,1,1,0), count = 119),      # 3-way
    list(pattern = c(0,1,1,0,1), count = 113),      # 3-way
    list(pattern = c(0,1,0,1,1), count = 113),      # 3-way
    list(pattern = c(0,0,1,1,1), count = 112),      # 3-way
    list(pattern = c(1,1,1,1,0), count = 109),      # 4-way
    list(pattern = c(1,1,1,0,1), count = 11),       # 4-way
    list(pattern = c(1,1,0,1,1), count = 7),        # 4-way
    list(pattern = c(1,0,1,1,1), count = 7),        # 4-way
    list(pattern = c(0,1,1,1,1), count = 7),        # 4-way
    list(pattern = c(1,1,1,1,1), count = 4)         # all 5
  )

  combined <- lapply(Sets, function(x) character(0))
  names(combined) <- Sets

  id_counter <- 1
  for (inter in intersections) {
    ids <- paste0("chr1_", id_counter:(id_counter + inter$count - 1))
    id_counter <- id_counter + inter$count
    for (i in seq_along(inter$pattern)) {
      if (inter$pattern[i] == 1) {
        combined[[i]] <- c(combined[[i]], ids)
      }
    }
  }

  return(combined)
}

combined <- create_upset_data()
站内所有文章版权归属LeftHeroAI导航站,无授权禁止任何主体转载、抄袭、复制内容,亦不得私自架设镜像站点。一经侵权,本站将通过法律途径追责。
相关文章






汇集全球数千款 AI 工具,每日持续更新,配套 AI 开发学习资源,轻松用 AI 提升工作效率。快捷键 Ctrl+D/⌘+D 一键收藏本站。