


在一个8×12的表格中,如何根据六种不同的单元格值来改变形状的颜色?
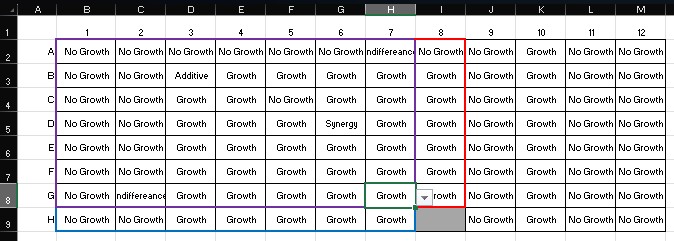
我正在尝试在Excel中创建一个由形状组成的图像,表示一个96孔板,其中图像中每个孔的颜色会根据在一个8x12的单元格表(B2:M9)中所选择的结果而变化。这个表的每个单元格可以输入6 种可能的结果,我希望把它们与在图像中变化的形状颜色对应起来:生长(黄色)、无生长(白色)、协同效应(绿色)、加性效应(蓝色)、无差异(灰色)和拮抗(橙色)。
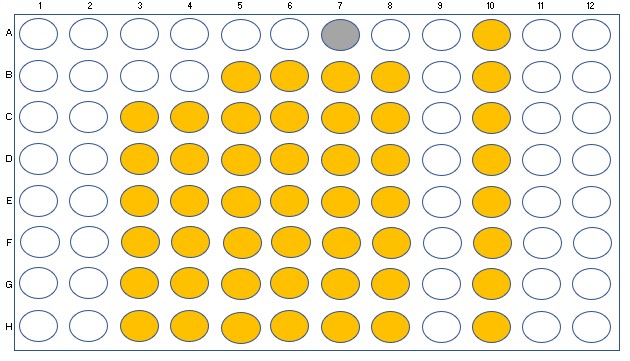
96孔板图像由96个独立的形状组成,我想根据对应孔在96单元格的8x12表中的结果来改变它们的颜色。这个板图像同样设置为8 行12列。左上角的第一个形状命名为 "Item1",向右是 "Item2",这种命名约定在横向从左到右进行;右下角的形状命名为 "Item96"。
这是我当前的代码,它能把Item1的颜色改对,但代码非常庞大且低效。当我把它复制/粘贴以影响Item1-Item12的颜色时,工作簿的运行速度会显著变慢。我需要它能够根据B2:M9表中每个单元格的单独结果,逐一改变这96个项目的颜色。
Private Sub Worksheet_Change(ByVal Target As Range)
If Range("B2") = "No Growth" Then
ActiveSheet.Shapes.Range(Array("Item1")).Select
Selection.ShapeRange.Fill.ForeColor.RGB = RGB(255, 255, 255)
Else
If Range("B2") = "Growth" Then
ActiveSheet.Shapes.Range(Array("Item1")).Select
Selection.ShapeRange.Fill.ForeColor.ObjectThemeColor = msoThemeColorAccent4
Else
If Range("B2") = "Synergy" Then
ActiveSheet.Shapes.Range(Array("Item1")).Select
Selection.ShapeRange.Fill.ForeColor.ObjectThemeColor = msoThemeColorAccent6
Else
If Range("B2") = "Additive" Then
ActiveSheet.Shapes.Range(Array("Item1")).Select
Selection.ShapeRange.Fill.ForeColor.ObjectThemeColor = msoThemeColorAccent1
Else
If Range("B2") = "Indifference" Then
ActiveSheet.Shapes.Range(Array("Item1")).Select
Selection.ShapeRange.Fill.ForeColor.ObjectThemeColor = msoThemeColorAccent3
Else
If Range("B2") = "Antagonism" Then
ActiveSheet.Shapes.Range(Array("Item1")).Select
Selection.ShapeRange.Fill.ForeColor.ObjectThemeColor = msoThemeColorAccent2
End If
End If
End If
End If
End If
End If
ActiveCell.Offset(0).Select
End Sub
有没有办法用循环来替代为每个单独的形状编写这段代码的做法?是否有更高效的写法?先行感谢。
解决方案
下面给出一个完整的示例,能够很容易地改造成在一张工作表上支持多块板。
这部分看起来可能代码很多,但我相信你应该能够看懂。如果对任意部分有疑问,请随时提出。
在包含板范围的工作表的工作表代码模块中:
Option Explicit

Const RNG_PLATE1 As String = "PLATE01" 'named range for the plate on this sheet

Private Sub Worksheet_Change(ByVal Target As Range)
    Dim rng As Range, rngPlate As Range
    Dim shp As Shape, c As Range, shpName As String, rw As Long, col As Long

    Set rngPlate = Me.Range(RNG_PLATE1)
    Set rng = Application.Intersect(rngPlate, Target)
    If rng Is Nothing Then Exit Sub 'change not in plate, no action to take

    For Each c In rng.Cells 'check each changed cell in the plate range
        rw = 1 + (c.Row - rngPlate.Row)         'calc row# and column#
        col = 1 + (c.Column - rngPlate.Column)
        shpName = ShapeName(1, rw, col)   'get the shape name
        Set shp = Me.Shapes(shpName)      'get the shape(could be a different sheet)
        shp.Fill.ForeColor.RGB = StatusColor(c.Value) 'assign the color
    Next c
End Sub
在普通模块中:
'Return a well label from row+column  Eg "C04"
Function WellLabel(rw As Long, col As Long) As String
    WellLabel = Chr(64 + rw) & Format(col, "00")
End Function

'Return the plate "name" given the plate number  Eg 1 >> "P01"
Function PlateLabel(pltNum As Long) As String
    PlateLabel = "P" & Format(pltNum, "00")
End Function

'Return a shape name given the plate number and well row/column
'  The name includes the well location
Function ShapeName(pltNum As Long, rwNum As Long, colNum As Long)
    ShapeName = PlateLabel(pltNum) & "_" & WellLabel(rwNum, colNum)
End Function

'return well color based on status
Function StatusColor(status As String) As Long
    Dim m, rngFlags As Range

     'Either do something like this....
'    Select Case status
'        Case "Growth": StatusColor = 13693658
'        Case "No Growth": StatusColor = 11323383
'        'etc etc
'        Case Else: StatusColor = vbWhite 'no color
'    End Select

    'Or do this, using a range with flags and cell fills
    '  More dynamic, and the end-user can set the names/colors
    '     with no code changes needed.
    Set rngFlags = ThisWorkbook.Worksheets("Sheet1").Range("FLAGS")
    m = Application.Match(status, rngFlags, 0)
    If Not IsError(m) Then 'found the text in the range?
        'get the fill from the matched cell
        StatusColor = rngFlags.Cells(m).Interior.Color
    Else
        'didn't find the text: use a default color
        StatusColor = vbWhite
    End If

End Function

'#### code below is for creating the plate layout using shapes

'create an example plate layout for "plate 1"
Sub CreatePlate1()
    CreatePlateShapes 1, ThisWorkbook.Worksheets("Sheet1").Range("B12")
End Sub

'Create a grid of shapes representing a plate
' rngTopLeft:Top-left cell for locating the plate visualization
' Name all the shapes so they can be located later
Sub CreatePlateShapes(pltNumber As Long, rngTopLeft As Range)
    Const NUM_ROWS As Long = 8
    Const NUM_COLS As Long = 12
    Const SHP_SZ As Long = 20     'shape size
    Const SHP_MARGIN As Long = 3  'gap between shapes
    Dim rw As Long, col As Long, posLeft, posTop

    'remove any existing plate shapes with same plate number
    ClearAnyPreviousLayout rngTopLeft.Parent, pltNumber

    '[re]create the shapes in a grid
    For rw = 1 To NUM_ROWS
        posTop = rngTopLeft.Top + (rw - 1) * (SHP_SZ + SHP_MARGIN)
        For col = 1 To NUM_COLS
            posLeft = rngTopLeft.Left + (col - 1) * (SHP_SZ + SHP_MARGIN)
            With rngTopLeft.Parent.Shapes.AddShape(msoShapeOval, _
                                 posLeft, posTop, SHP_SZ, SHP_SZ)
                .Name = ShapeName(pltNumber, rw, col) 'unique name for plate (Plate# + well)
                .Fill.ForeColor.RGB = vbWhite         'default fill
                .Line.Weight = 0.25
                .Line.ForeColor.RGB = 14259021
            End With
        Next col
    Next rw
End Sub

Sub ClearAnyPreviousLayout(ws As Worksheet, pltNum As Long)
    Dim i As Long
    For i = ws.Shapes.Count To 1 Step -1
        With ws.Shapes(i)
            'remove shape if plate number matches
            If .Name Like PlateLabel(pltNum) & "_*" Then .Delete
        End With
    Next i
End Sub
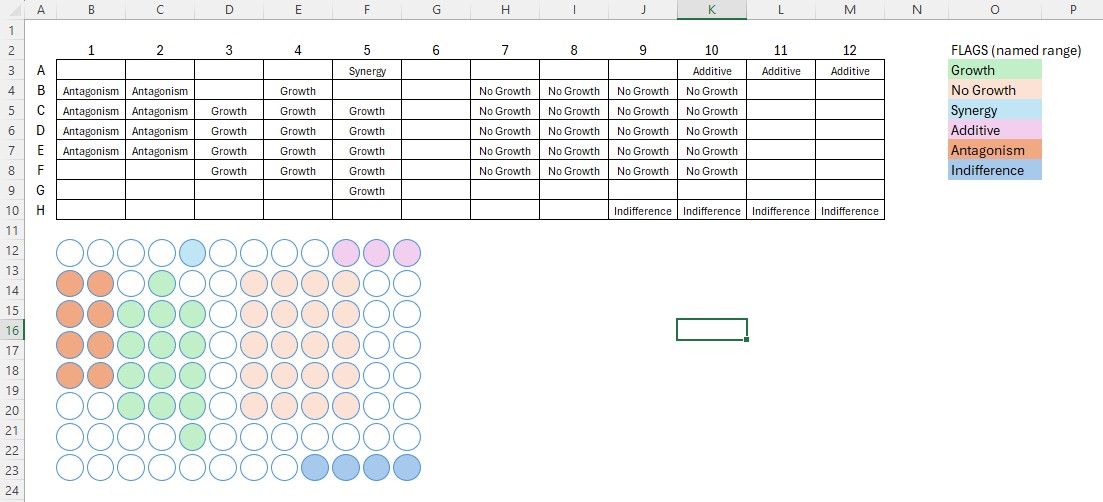
我的测试工作表:
不过,与其用形状来表示一块板,使用一个区域来给单元格着色会容易得多。代码更少,管理起来也更容易。
站内所有文章版权归属LeftHeroAI导航站,无授权禁止任何主体转载、抄袭、复制内容,亦不得私自架设镜像站点。一经侵权,本站将通过法律途径追责。
相关文章








汇集全球数千款 AI 工具,每日持续更新,配套 AI 开发学习资源,轻松用 AI 提升工作效率。快捷键 Ctrl+D/⌘+D 一键收藏本站。