


在不改变置信区间颜色的前提下,改变图例中符号的颜色
我有下面这段绘图代码:
ggplot(SR_data, aes(x = day, y = max_temp, colour = season2, shape = season2)) +
  geom_point(size = 1.5, show.legend = TRUE) +
  stat_smooth(formula = y ~ x, method = "lm", se = TRUE) +
  scale_colour_manual(values = c("black", "snow4"), labels = c("Shoulder", "Dry"))+
  guides(fill = c("none"), shape = "none", color = guide_legend(override.aes = list(size = 3, shape = c(21,24), fill = c("black", "snow4"))))+
  scale_x_continuous(breaks = seq(0, 120, 10)) +
  labs(x = "Day",y = "Maximum daily temperature (°C)") +
  theme_few() +
  theme(legend.position = c(0.1, 0.85), text = element_text(size = 13), axis.title.y = element_text(margin = margin(r = 10)), axis.title.x = element_text(margin = margin(t = 10)), legend.title = element_blank())
绘出的是这样的图:
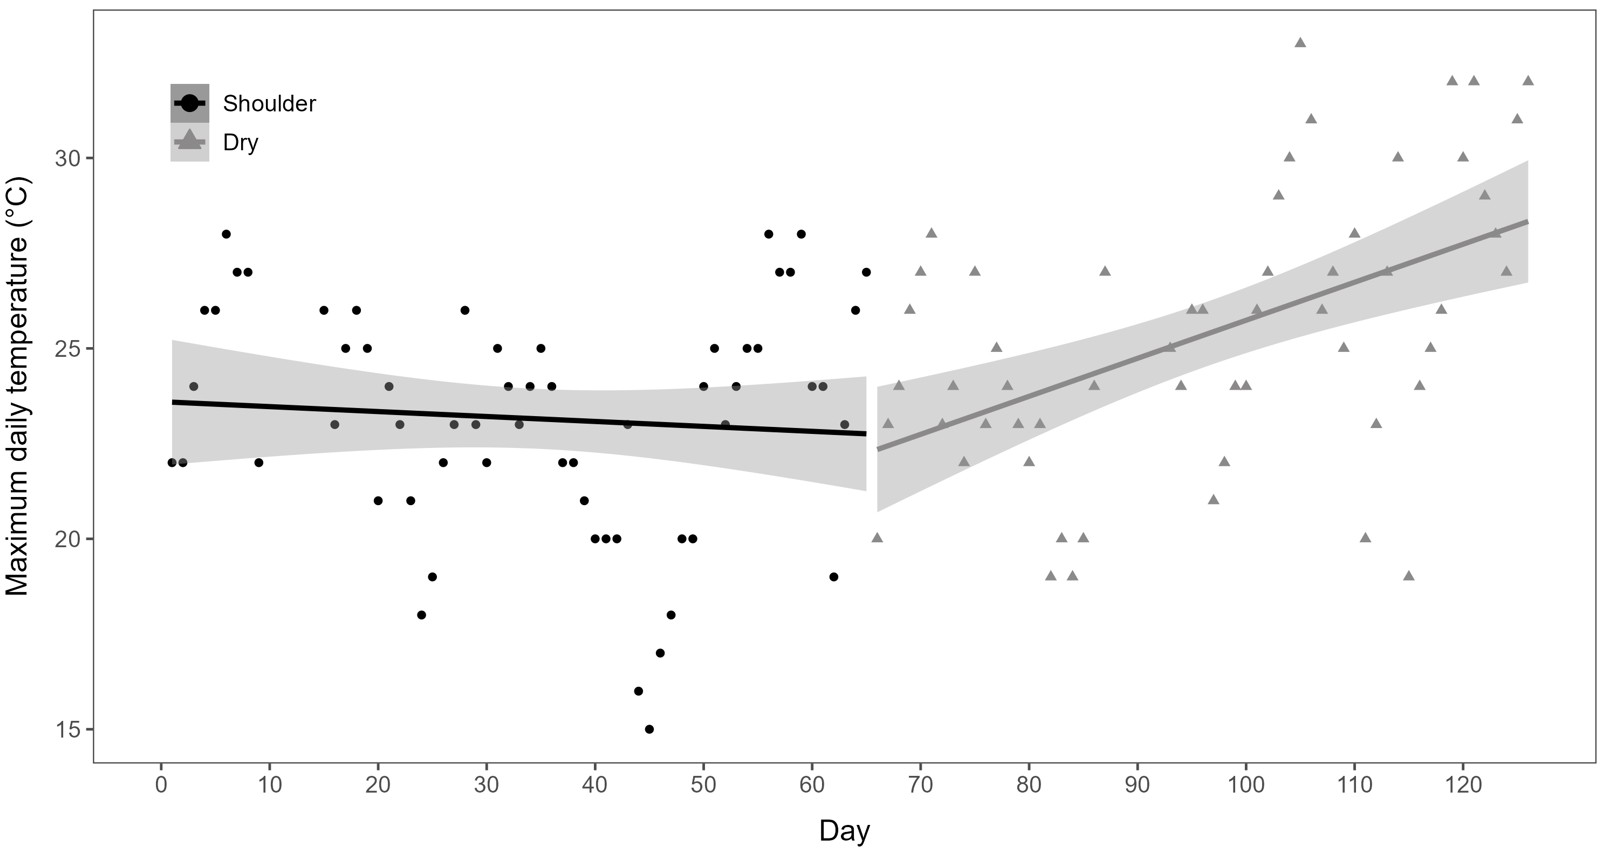
我想把图例中“Shoulder”的背景色改成,与其他区间相同的淡灰色,因为它表示置信区间。目前,我在用 guide_legend(override.aes) 来自定义图例。我尝试在 fill = c("black", "snow4") 中把 fill 换成 colour,但那样符号就不会被填充了...
有没有办法把它改成这样?
如果需要,这里有一些模拟数据:
vec1 <- c("shoulder","shoulder","shoulder","shoulder","shoulder","dry","dry","dry","dry","dry")
vec2 <- c(0,1,2,3,4,5,6,7,8,9,10)
vec3 <- c(24,25,26,32,30,32,29,28,27,31)

SR_data <- data.frame(
  season2 = vec1,
  day = vec2,
  max_temp = vec3
)
解决方案
大概是这样?
我创建了一个具名向量 shape_pnts,用来把形状分配给正确的数据,并把 fill 在 override.aes 中改为 c("snow4", "snow4")。
另外,vec2 多出一个元素,我把最后一个删掉了。
vec1 <- c("shoulder","shoulder","shoulder","shoulder","shoulder","dry","dry","dry","dry","dry")
vec2 <- c(0,1,2,3,4,5,6,7,8,9)
vec3 <- c(24,25,26,32,30,32,29,28,27,31)
ls(pattern = "vec") |> mget() |> lengths()
#> vec1 vec2 vec3
#>   10   10   10
SR_data <- data.frame(
  season2 = vec1,
  day = vec2,
  max_temp = vec3
)

library(ggplot2)
library(ggthemes)

# these shapes are solid shapes, only aes 'colour' has an effect, not 'fill'
# note that they must come in alphabetic order, 'override.aes
# uses the new vector's order
shape_pnts <- c(dry = 19, shoulder = 17)

ggplot(SR_data, aes(x = day, y = max_temp, colour = season2, shape = season2)) +
  geom_point(size = 1.5, show.legend = TRUE) +
  stat_smooth(formula = y ~ x, method = "lm", se = TRUE) +
  scale_colour_manual(
    values = c("black", "snow4"),
    labels = c("Shoulder", "Dry")
  ) +
  scale_shape_manual(values = shape_pnts) +
  guides(
    fill = c("none"),
    shape = "none",
    color = guide_legend(
      override.aes = list(
        size = 3,
        # shape = c(19, 17),
        shape = shape_pnts,
        fill = c("snow4", "snow4")
      )
    )
  ) +
  scale_x_continuous(breaks = seq(0, 120, 10)) +
  labs(x = "Day",y = "Maximum daily temperature (°C)") +
  theme_few() +
  theme(
    legend.position = c(0.1, 0.85),
    text = element_text(size = 13),
    axis.title.y = element_text(margin = margin(r = 10)),
    axis.title.x = element_text(margin = margin(t = 10)),
    legend.title = element_blank()
  )
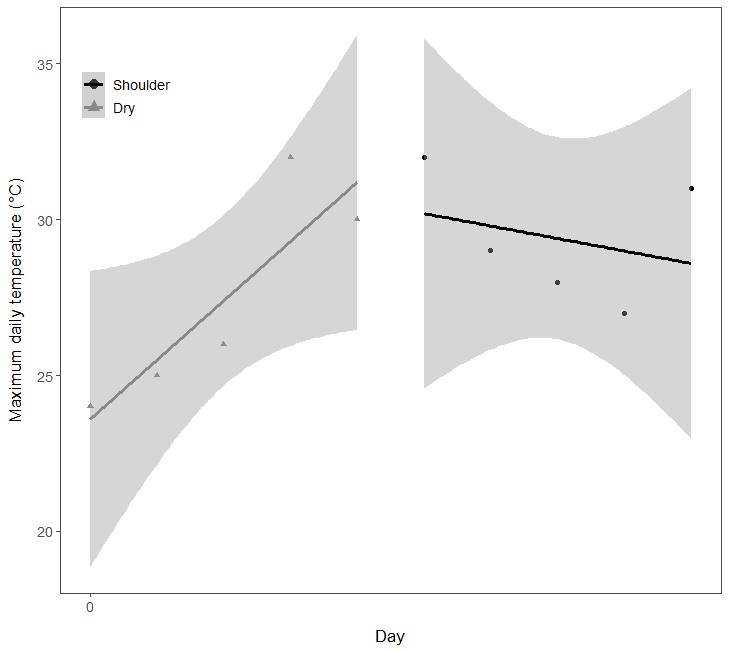
创建于2026-04-18,使用 reprex v2.1.1
站内所有文章版权归属LeftHeroAI导航站,无授权禁止任何主体转载、抄袭、复制内容,亦不得私自架设镜像站点。一经侵权,本站将通过法律途径追责。
相关文章






汇集全球数千款 AI 工具,每日持续更新,配套 AI 开发学习资源,轻松用 AI 提升工作效率。快捷键 Ctrl+D/⌘+D 一键收藏本站。