


如何在图例中使用title lc变量来设置默认的线条颜色
在一个程序中,我有以下复杂的命令它在大约20列的数据中绘制不同的曲线:
plot "file.txt" using 2:($5 == 1 && $6==2 ? $10 : 1/0):($6) t "p12 Both sexes" with points pt 7 ps 0.4 lc variable
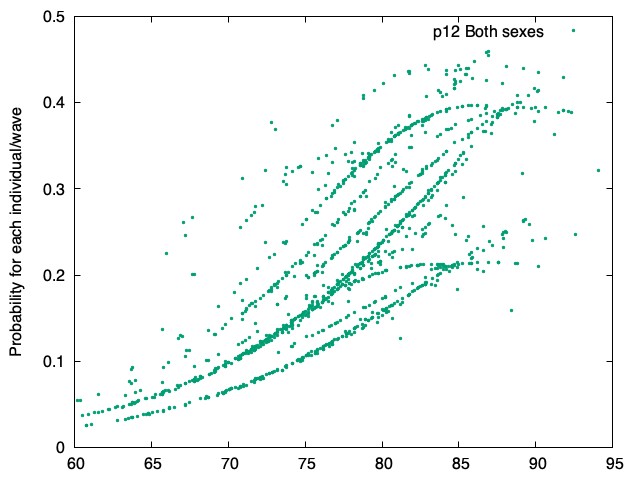 点的颜色随第六列的数值变化(主要是1、2或 3),但由于using的第二个参数只选择第六列等于2 的行(第五列为1),因此该图的图例在“p12 Both sexes”之后是一个颜色为6 的点。这样就能正常工作。
但如果想让点的颜色根据第19列的取值来变化(名为V1,男性为0、女性为1),我可以把命令改成:
plot "file.txt" u 2:($5 == 1 && $6==2 ? $10 : 1/0):($19==0 ? $6 : $6+4) t "p12 Men (unchanged color) vs Women (changed color)" with points pt 7 ps 0.4 lc variable
V1=0时 DOTS的颜色是 $6(Gnuplot的颜色2),V1=1时是 $6+4=6,这个是正确的。
然而我希望图例后面的点的颜色确实与改变后的颜色“p12 Men(颜色不变) vs Women(颜色改变)”一致。但它并没有对应到改变后的颜色,我们也不知道哪些点是女性。图例的颜色(仅图例本身)是不可预测的!
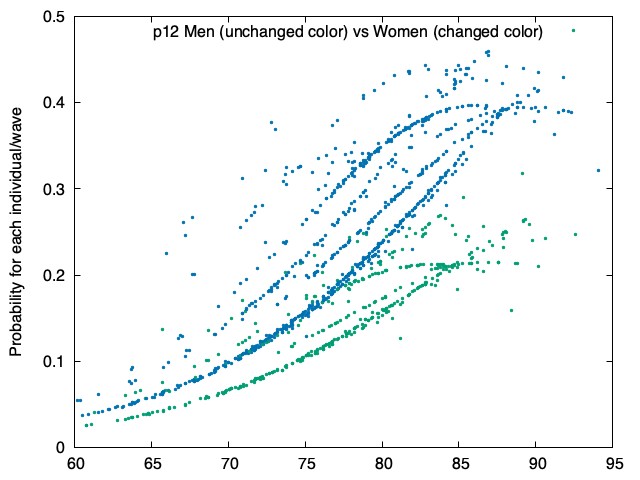
gnuplot的规则并不明确,因为如果我改为
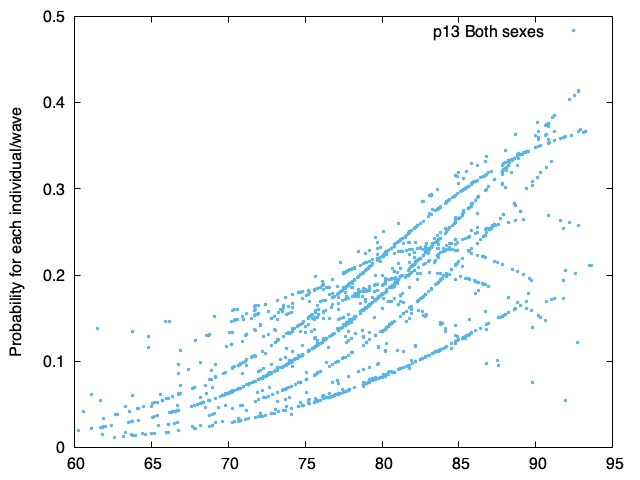
2:($5 == 1 && $6==3 ? $10 : 1/0):($19==0 ? $6 : $6+4) t "p13 Men (unchanged color) vs Women (changed color)"
也就是绘制取值为3 的个体(而不是2),图例中对两性都为3 的颜色是正确
对于女性,图例的颜色现在是 $6+4(7是红色)(不再是 $6),这是正确的。
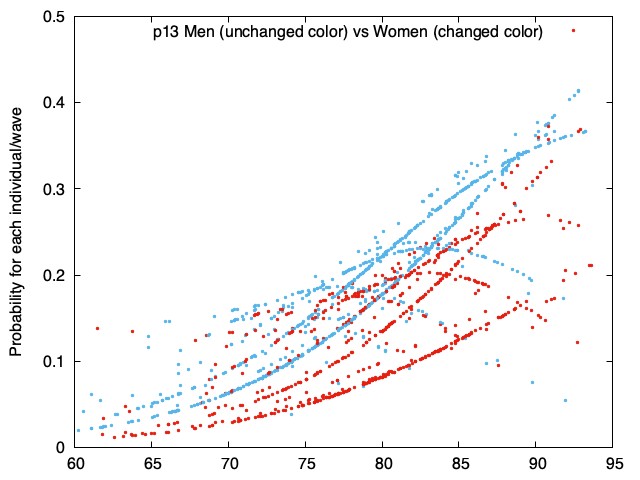
我不知道在gnuplot(6.0补丁级别3)中图例颜色的规则。
解决方案
gnuplot在一个绘图命令行内(若不是循环)为图例创建一个条目。因此,如果颜色是可变的,gnuplot应该把哪种颜色放入图例?第一种、最后一种,还是中间的某种颜色?我不知道你可以设定某种“默认颜色”。你需要用不同的方式来设置。
你可以绘制你的数据(看起来在你的脚本中是可行的),然后手动处理图例。检查 help keyentry。
不过,我猜想你是想从数据文件中读取颜色值。
据我理解,你有数据并希望基于3 列来筛选并给数据着色。 下面的脚本创建了一些简化的测试数据。
# 1   2   3        4        5       6
# x   y   param1   param2   gender  color
  ...
  ...
Column 1,2:  x,y real values in the range [0:1]
Column 3:    parameter1 integer in the range [1:2]
Column 4:    parameter2 integer in the range [1:3]
Column 5:    gender integer in the range [0:1]
Column 6:    color integer in the range [1:3]
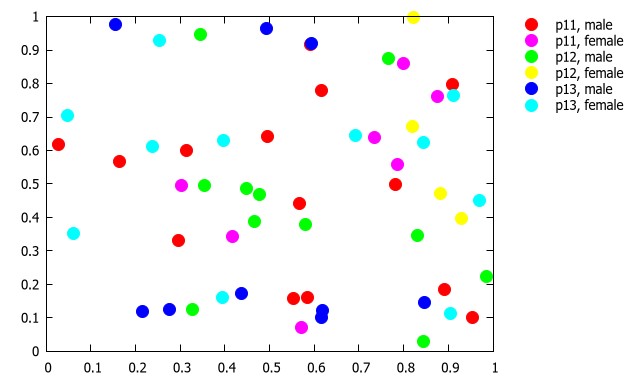
如果你使用嵌套循环,可以在每次迭代中筛选数据并固定颜色,同时在图例中相应地设置条目。在下面的示例中,你可以设定你自己的颜色序列;若第5 列的值不是0 而是1,颜色会向后移位3。 希望你能将这个最小示例改造成符合你的需求。
脚本:
### filter and color data according to 3 columns
reset session

# create some random test data
set table $Data
    plot '+' u (rand(0)):(rand(0)):(int(rand(0)*2+1)):(int(rand(0)*3+1)):(int(rand(0)*2)) w table
unset table

set key out noautotitle reverse Left

gender(g)  = word("male female",g+1)
colors     = "0xff0000 0x00ff00 0x0000ff 0xff00ff 0xffff00 0x00ffff"
color(c,g) = int(word(colors, int(column(c) + column(g)*3)))

plot for [p1=1:1] for [p2=1:3] for [g=0:1] $Data u 1: \
     ($3==p1 && $4==p2 && $5==g ? $2 : NaN):(color(4,5)) \
     w p pt 7 ps 2 lc rgb var ti sprintf("p%d%d, %s",p1,p2,gender(g))
### end script
结果:
相关文章





