


在自定义统计函数中获取gtsummary推断出的实际变量类型
如果一个变量的水平数为10个或更少,无论它是分类变量、数值型变量,还是字符型变量,gtsummary 将其视为因子变量,并对每个水平显示统计量。
我正在添加一个自定义统计量,对于连续变量,显示均值差异;对于因子变量,显示每个水平的百分比差异。
现在考虑下面的例子:
library(gtsummary)
library(extraDistr)
library(tidyverse)
library(magrittr)
library(glue)
library(gtools)
library(forcats)

N <- 1000
toydf <- data.frame(
  # Numeric variable with 4 possible values (0,1,2,3)
  children = rbinom(N, size = 3, prob = 0.5),
  # Numeric variable with a lot of levels
  age = rdunif(N, 10, 100),
  # Factor variable with 2 levels
  gender = sample(c("M", "F"), N, replace = TRUE),
  # Factor variable with 20 levels
  human_type = sample(paste0("Type_", seq(1,20)), N, replace = TRUE)
)
toydf$age %<>% as.integer()
toydf$gender %<>% as.factor()
toydf$human_type %<>% as.factor()
toydf$human_type %<>% fct_relevel(mixedsort(levels(.)))

# Custom statistic
# For continuous variables, show difference in mean
# For factor variables, show difference in percentanges for each level
my_mean_diff <- function(data, variable, by, tbl, ...) {

  x <- data[[variable]]
  g <- data[[by]]
  lvls <- levels(g)
  vartype <- class(x)[1]

  if(
    (vartype=="character" | vartype=="numeric" | vartype=="integer") &
    length(unique(x)) <= 10
  )
  {
    vartype <- "factor"
  }

  print(paste0("Variable: ", variable, ", Type: ", vartype))

  switch(
    vartype,
    factor = {
      prop <- prop.table(table(x, g), margin = 2)
      return((prop[, lvls[2]] - prop[, lvls[1]]) * 100)
    },
    integer = {
      return(diff(tapply(x, g, mean, na.rm = TRUE)))
    },
    {
      stop(glue("ERROR: Unrecognized type {vartype}"))
    }
  )
}

toydf %>%
  tbl_summary(
    by = "gender",
    percent = "column"
  ) %>% add_stat(
    fns = everything() ~ my_mean_diff,
    location = list(
      all_continuous() ~ "label",
      all_categorical() ~ "level",
      all_dichotomous() ~ "label"
    )
  )
产生的结果是:
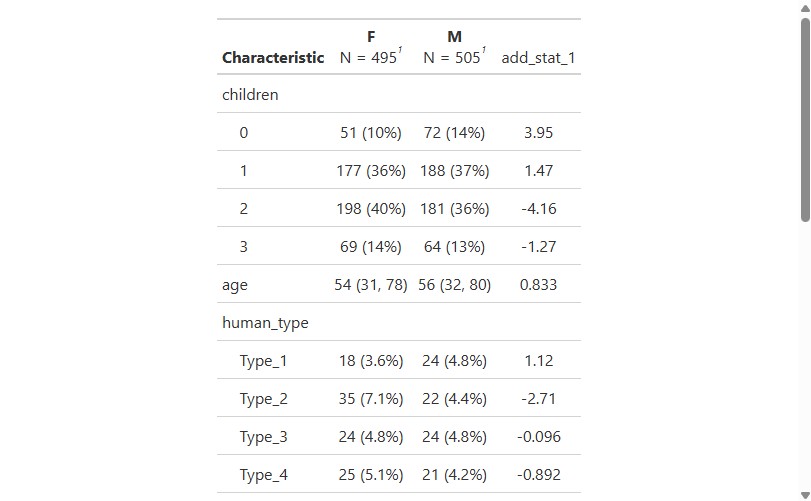
到目前为止,一切都挺顺利。因为 children 的水平数为10个或更少,所以被视为分类变量,而我的自定义统计量函数也能处理这种情况。
但现在假设我想让 gtsummary 将 children 视为数值变量。
我可以通过 type 参数来实现:
toydf %>%
  tbl_summary(
    by = "gender",
    percent = "column",
    type = list("children" ~ "continuous")
  ) %>% add_stat(
    fns = everything() ~ my_mean_diff,
    location = list(
      all_continuous() ~ "label",
      all_categorical() ~ "level",
      all_dichotomous() ~ "label"
    )
  )
现在出现了一个错误:
Error in `add_stat()`:
! Dimension of "children" and the added statistic do not match.
ℹ Expecting statistic/data frame to be length/no. rows 1.
Run `rlang::last_trace()` to see where the error occurred.
因为我的统计量正在为每个水平生成一个变量,而 gtsummary 现在将其视为数值变量。
如何在我的自定义统计量函数中获取 gtsummary 使用的“真实”类型?
解决方案
与其手动复现gtsummary的类型检测逻辑(例如少于10个唯一值就会被判定为分类变量),不如直接查询在使用 tbl$table_body$var_type 时,gtsummary 实际被分配的类型。
my_mean_diff <- function(data, variable, by, tbl, ...) {
  x <- data[[variable]]
  g <- data[[by]]
  lvls <- levels(g)

  var_type <- tbl$table_body |>
    filter(variable == !!variable) |>
    pull(var_type) |>
    first()

  switch(
    var_type,
    categorical = ,
    dichotomous = {
      prop <- prop.table(table(x, g), margin = 2)
      (prop[, lvls[2]] - prop[, lvls[1]]) * 100
    },
    continuous = {
      diff(tapply(x, g, mean, na.rm = TRUE))
    },
    stop(glue("ERROR: Unrecognized type {var_type}"))
  )
}
toydf %>%
  tbl_summary(
    by = "gender",
    percent = "column",
    type = list("children" ~ "continuous")
  ) %>% add_stat(
    fns = everything() ~ my_mean_diff,
    location = list(
      all_continuous() ~ "label",
      all_categorical() ~ "level",
      all_dichotomous() ~ "label"
    )
  )
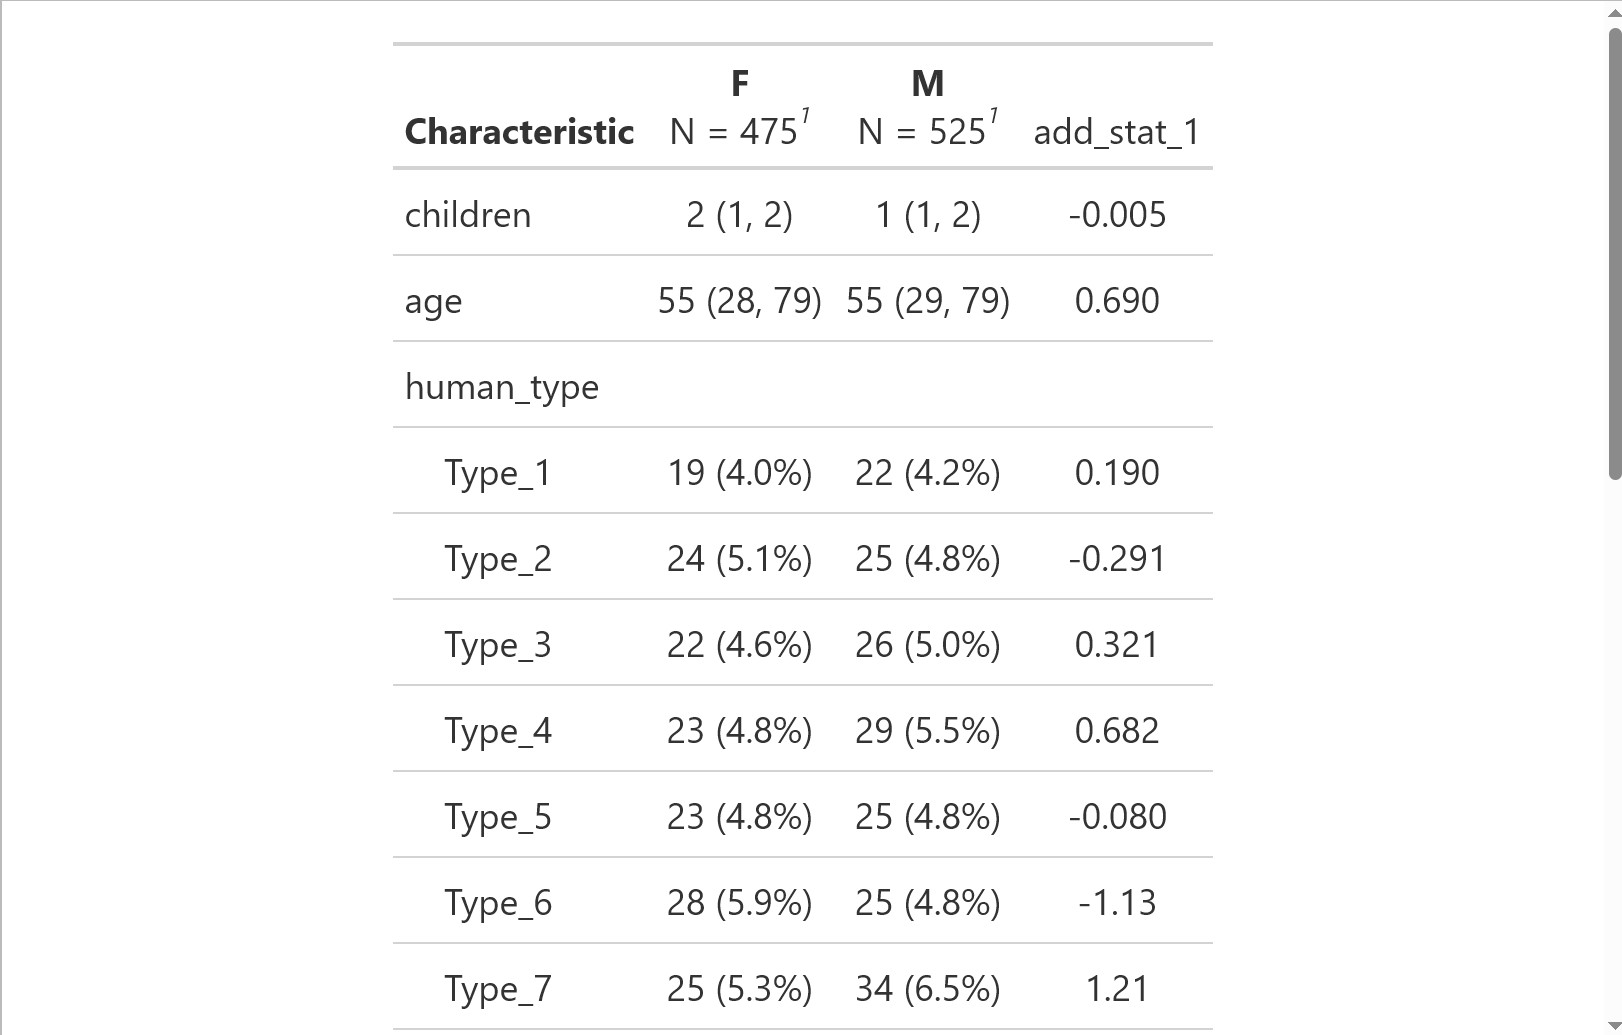
站内所有文章版权归属LeftHeroAI导航站,无授权禁止任何主体转载、抄袭、复制内容,亦不得私自架设镜像站点。一经侵权,本站将通过法律途径追责。
相关文章






汇集全球数千款 AI 工具,每日持续更新,配套 AI 开发学习资源,轻松用 AI 提升工作效率。快捷键 Ctrl+D/⌘+D 一键收藏本站。