


网格相对于数据点的偏移
我已经在一个类中定义了一个绘图方法,其中 self.steps 是一个由字典组成的列表的列表,包含不同的 "feature": value 关联。这里的 self.path_alignments 也是一个用来表示x 轴长度的元组列表。在绘图时,我把网格布局设为可见,但放在x 轴上的数据点索引逐渐错位,直到到达x 轴尽头时会出现整整一个网格步长的错位。
下面是方法定义:
    def plot_trans(self, feature):
        feature_trans = []
        for frame in self.steps:
            feature_trans.append([datapoint[feature] for datapoint in frame])
        ymax = max(feature_trans[0] + feature_trans[self.size-1]) + .1
        ymin = min(feature_trans[0] + feature_trans[self.size-1]) - .1
        fig, axes = plt.subplots(nrows=self.size, ncols=1, figsize=(10, 12), sharex=True)
        x = np.linspace(0, len(self.path_alignments), len(self.path_alignments))
        for i, array in enumerate(feature_trans):
            axes[i].plot(x, array, color="green", marker="o")
            axes[i].set_ylim([ymin, ymax])
            axes[i].set_ylabel(f"frame {i+1}")
            axes[i].set_xticks(range(len(self.path_alignments)))
            axes[i].set_xticklabels(range(1, len(self.path_alignments)+1))
            axes[i].tick_params(axis="x", rotation=90)
            axes[i].grid(which="both", alpha=0.3)
        axes[-1].set_xlabel(f"Feature transition '{feature}'")
        plt.tight_layout()
        plt.show()
下面是一张绘制函数示例调用的图片:
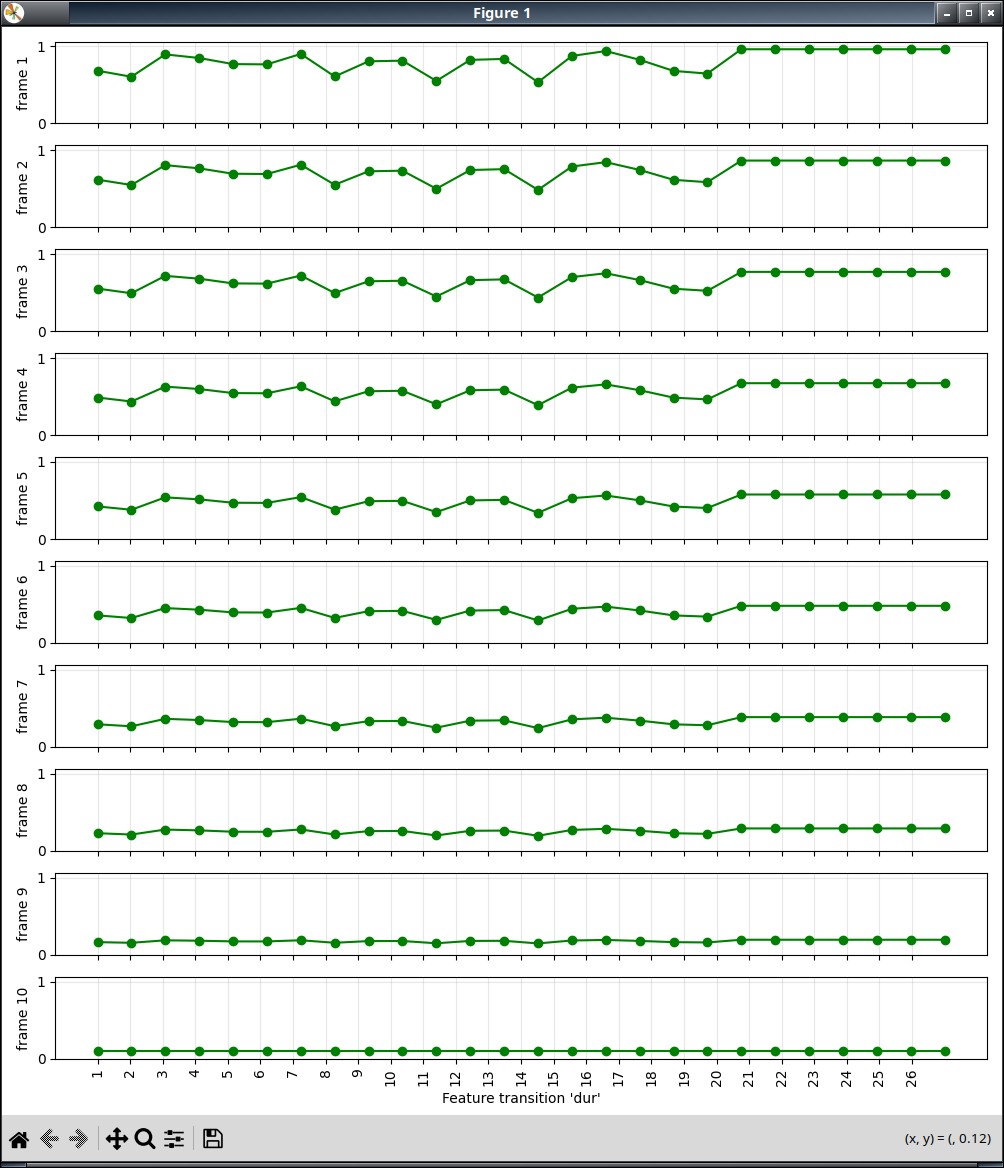
正如你在每一帧(1到 10)看到的,点会慢慢相对于x 轴网格错位。
有人能解释问题出在哪里吗?
解决方案
因为 x = np.linspace(0, len(self.path_alignments), len(self.path_alignments)) 生成了以下序列
0,1.04,2.08,3.12,4.16,5.2,6.24,7.28,8.32,9.36,10.4,11.44,12.48,13.52,14.56,15.6,16.64,17.68,18.72,19.76,20.8,21.84,22.88,23.92,24.96,26
但 range(len(self.path_alignments)) 在 set_xticks 中生成了
0,1,2,3,4,5,6,7,8,9,10,11,12,13,14,15,16,17,18,19,20,21,22,23,24,25
这就导致了错位。
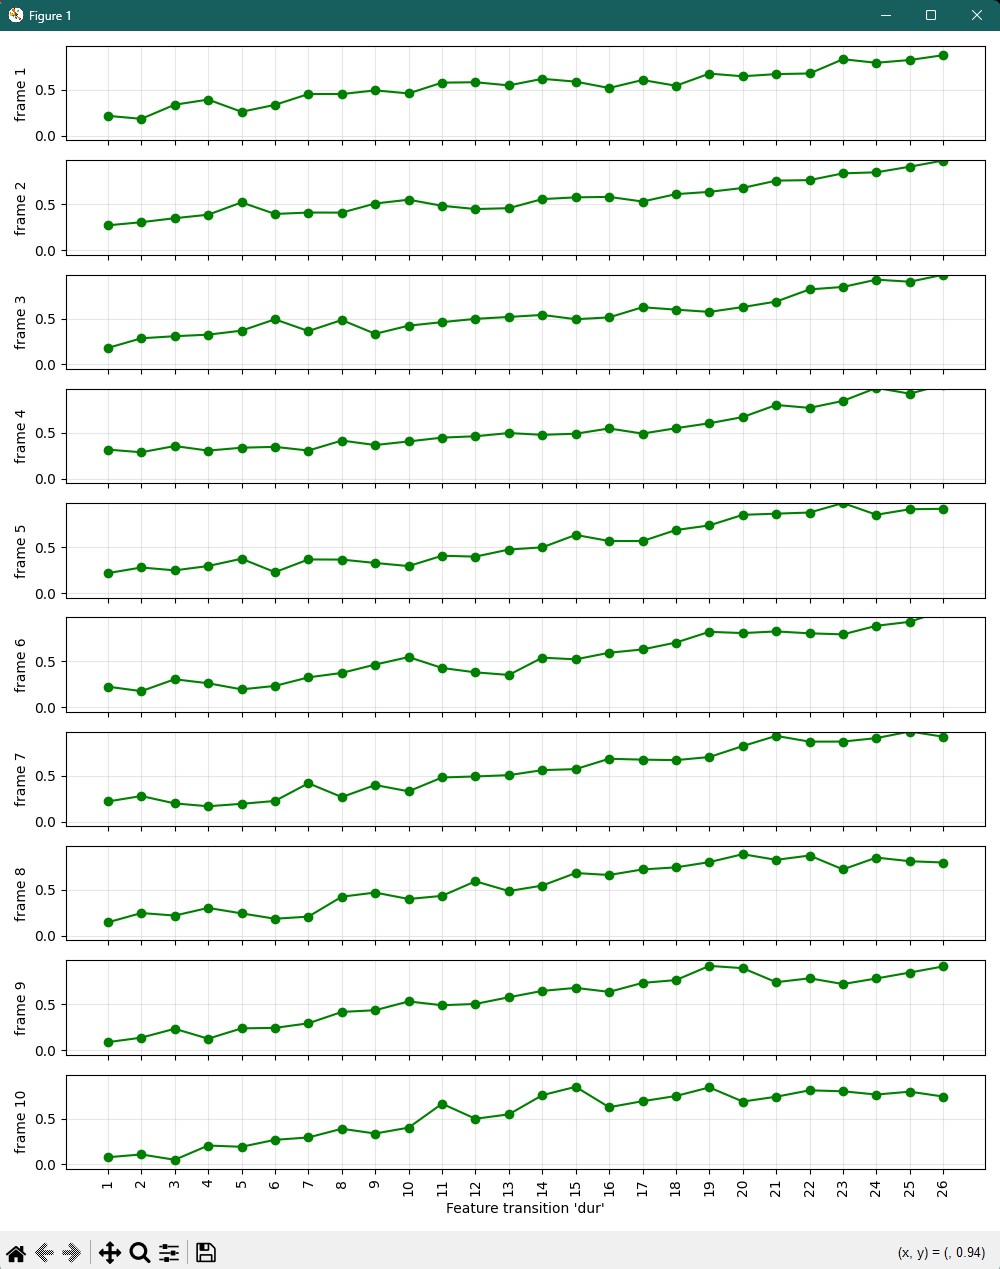
你可以改用 np.arange(len(self.path_alignments)):
import matplotlib.pyplot as plt
import numpy as np


class Plot:
    def __init__(self, size=10, n_alignments=26):
        self.size = size
        self.path_alignments = list(range(n_alignments))
        self.steps = []

        # example data
        rng = np.random.default_rng(42)
        n = len(self.path_alignments)
        base = np.linspace(0.2, 0.9, n)
        for i in range(self.size):
            values = base + 0.08 * np.sin(np.linspace(0, 2 * np.pi, n) + i * 0.5) + rng.normal(0, 0.06, n)
            self.steps.append([{"dur": value} for value in values])

    def plot_trans(self, feature):
        feature_trans = []
        for frame in self.steps:
            feature_trans.append([datapoint[feature] for datapoint in frame])
        ymax = max(feature_trans[0] + feature_trans[self.size - 1]) + 0.1
        ymin = min(feature_trans[0] + feature_trans[self.size - 1]) - 0.1
        fig, axes = plt.subplots(nrows=self.size, ncols=1, figsize=(10, 12), sharex=True)
        n = len(self.path_alignments)
        x = np.arange(n)  # the fix
        for i, array in enumerate(feature_trans):
            axes[i].plot(x, array, color="green", marker="o")
            axes[i].set_ylim([ymin, ymax])
            axes[i].set_ylabel(f"frame {i + 1}")
            axes[i].grid(which="both", alpha=0.3)
        # you don't need to set these for all axes, because `sharex=True`
        axes[-1].set_xticks(x)
        axes[-1].set_xticklabels(range(1, n + 1), rotation=90)
        axes[-1].set_xlabel(f"Feature transition '{feature}'")
        plt.tight_layout()
        plt.show()


plotter = Plot()
plotter.plot_trans("dur")
站内所有文章版权归属LeftHeroAI导航站,无授权禁止任何主体转载、抄袭、复制内容,亦不得私自架设镜像站点。一经侵权,本站将通过法律途径追责。
相关文章






汇集全球数千款 AI 工具,每日持续更新,配套 AI 开发学习资源,轻松用 AI 提升工作效率。快捷键 Ctrl+D/⌘+D 一键收藏本站。