


无法将Leaflet插件集成到R Shiny应用程序中
我想把 leaflet-labeler插件 集成到一个渲染Leaflet地图的R Shiny应用中,但一直进展甚微。
GeoJson数据是一个带有属性 "label" 的点层FeatureCollection(通过 fromJSON 函数读取,属于 jsonlite 包),其中的HTML将作为标签显示在地图上,插件应避免标签之间的冲突。我希望得到的输出与GitHub上的示例类似。
数据(来自 dput(geojson)):
list(type = "FeatureCollection", features = list(list(type = "Feature",
properties = list(punto = 1L, unicode = "štéĭnle̤",
html = "štéĭnle̤", label = "<em style=\"color:#ec008d\">1</em> štéĭnle̤"),
geometry = list(type = "Point", coordinates = list(8.423711786,
46.38731673))), list(type = "Feature", properties = list(
punto = 229L, unicode = "s̓as̓ét", html = "s̓as̓ét",
label = "<em style=\"color:#ec008d\">229</em> s̓as̓ét"),
geometry = list(type = "Point", coordinates = list(11.00240679,
46.1641373))), list(type = "Feature", properties = list(
punto = NULL, unicode = NULL, html = NULL, label = "<em style=\"color:#ec008d\">NA</em> "),
geometry = list(type = "Point", coordinates = list(13.30003463,
42.79799721))), list(type = "Feature", properties = list(
punto = NULL, unicode = NULL, html = NULL, label = "<em style=\"color:#ec008d\">NA</em> "),
geometry = list(type = "Point", coordinates = list(13.3426341,
41.6396009))), list(type = "Feature", properties = list(
punto = 941L, unicode = "na pet̬ři̍d̰d̰a", html = "na pet̬ři̍d̰d̰a",
label = "<em style=\"color:#ec008d\">941</em> na pet̬ři̍d̰d̰a"),
geometry = list(type = "Point", coordinates = list(16.31308204,
39.31875679))), list(type = "Feature", properties = list(
punto = 214L, unicode = "s̓as̓ẹdẹli̍n", html = "s̓as̓ẹdẹli̍n",
label = "<em style=\"color:#ec008d\">214</em> s̓as̓ẹdẹli̍n"),
geometry = list(type = "Point", coordinates = list(10.88553927,
46.33220307))), list(type = "Feature", properties = list(
punto = 828L, unicode = "u vrəččə͐tíe͐ddə", html = "u vrəčč<sup>ə</sup>tí<sup>e</sup>ddə",
label = "<em style=\"color:#ec008d\">828</em> u vrəčč<sup>ə</sup>tí<sup>e</sup>ddə"),
geometry = list(type = "Point", coordinates = list(16.4131601,
41.1534886))), list(type = "Feature", properties = list(
punto = 764L, unicode = "perdiǧèd̰ḏ͐a", html = "perdiǧèd̰<sup>d̰</sup>a",
label = "<em style=\"color:#ec008d\">764</em> perdiǧèd̰<sup>d̰</sup>a"),
geometry = list(type = "Point", coordinates = list(9.655999729,
39.92658912))), list(type = "Feature", properties = list(
punto = NULL, unicode = NULL, html = NULL, label = "<em style=\"color:#ec008d\">NA</em> "),
geometry = list(type = "Point", coordinates = list(14.1635845,
42.347886))), list(type = "Feature", properties = list(
punto = 806L, unicode = "pətrəččòla , vrəččo̍dda",
html = "pətrəččòla , vrəččo̍dda",
label = "<em style=\"color:#ec008d\">806</em> pətrəččòla , vrəččo̍dda"),
geometry = list(type = "Point", coordinates = list(15.63804725,
41.71244172)))))
在尝试理解如何在Shiny中管理插件之后,我目前的进展如下:
界面(UI):
library(shiny)
library(leaflet)
library(leaflet.extras)
library(htmltools)
library(htmlwidgets)

 ui <- fluidPage(
    tags$head(
             tags$script(src = "leaflet-labeler.js"),
             tags$link(src = "leaflet-labeler.css")
             ),
    leafletOutput("map")
  )
服务器端(SERVER):
server <- function(input, output, session) {
labeler <- htmlDependency(
  name = "leaflet-labeler",
  version = "1.0.0",
  src = c(file = normalizePath("app\\www")),
  script = "leaflet-labeler.js",
  stylesheet = "leaflet-labeler.css"
)

registerPlugin <- function(map, plugin) {
  map$dependencies <- c(map$dependencies, list(plugin))
  map
}

leaflet() %>%
  addTiles()%>%
  #addGeoJSON(geojson_data) %>% works up to here
  registerPlugin(labeler) %>%
  onRender(
    "
    function(el, x, geojson) {

    const layer = L.labeler(geojson, {
    labelProp: 'label',
    labelPos: 'auto'
    }).addTo(this);
    ",
    data = geojson)
}
就目前而言,地图上没有任何渲染;如果我添加GeoJSON图层,标记会被正确渲染,因此问题不在数据上。我怀疑插件的应用其实比看起来更复杂。JS代码是直接按插件GitHub页面上的API描述获取的;不过我要补充的是,我在JavaScript一窍不通,无法真正解读到底哪里出现了问题。
任何建议都将不胜感激。
解决方案
The R-parts
- 在Shiny中,一种做法是直接使用
tags$script来包含脚本。你需要按照GitHub页面所示,包含极简的 minimal CSS。
ui <- fluidPage(
  tags$script(src = "https://samanbey.github.io/leaflet-labeler/leaflet-labeler.js"),
  tags$link(rel ="stylesheet", href="https://samanbey.github.io/leaflet-labeler/leaflet-labeler.css")
)
- 参考
?leafletOutput:要让地图渲染,在服务器端需要设置output$map = renderLeaflet(map)。
The JavaScript-parts
首先,你在 onRender-function的结尾缺少一个闭括号 }。
【下面有一个演示】Here is a demonstration 展示了如何设置leaflet-labeler。
其中的难点是
- 你必须把
addGeoJSON(geojson)替换成扩展自普通addGeoJSON()的JavaScript。此外,属性pointToLayer需要像 这一行 那样设定。 - JavaScript变量
map在另一个函数中初始化,因此无法全局访问。这条回答对我帮助很大——我们需要用window.map = this;来修复,否则map将引用不到任何东西。
代码
library(shiny) # for shiny app
library(htmlwidgets) # for onRender
library(leaflet) # for leaflet functions
geojson <- list( type = "FeatureCollection", features = list( list( type = "Feature", properties = list( punto = 1L, unicode = "štéĭnle̤", html = "štéĭnle̤", label = "<em style=\"color:#ec008d\">1</em> štéĭnle̤" ), geometry = list( type = "Point", coordinates = list(8.423711786, 46.38731673) ) ), list( type = "Feature", properties = list( punto = 229L, unicode = "s̓as̓ét", html = "s̓as̓ét", label = "<em style=\"color:#ec008d\">229</em> s̓as̓ét" ), geometry = list( type = "Point", coordinates = list(11.00240679, 46.1641373) ) ), list( type = "Feature", properties = list( punto = NULL, unicode = NULL, html = NULL, label = "<em style=\"color:#ec008d\">NA</em> " ), geometry = list( type = "Point", coordinates = list(13.30003463, 42.79799721) ) ), list( type = "Feature", properties = list( punto = NULL, unicode = NULL, html = NULL, label = "<em style=\"color:#ec008d\">NA</em> " ), geometry = list( type = "Point", coordinates = list(13.3426341, 41.6396009) ) ), list( type = "Feature", properties = list( punto = 941L, unicode = "na pet̬ři̍d̰d̰a", html = "na pet̬ři̍d̰d̰a", label = "<em style=\"color:#ec008d\">941</em> na pet̬ři̍d̰d̰a" ), geometry = list( type = "Point", coordinates = list(16.31308204, 39.31875679) ) ), list( type = "Feature", properties = list( punto = 214L, unicode = "s̓as̓ẹdẹli̍n", html = "s̓as̓ẹdẹli̍n", label = "<em style=\"color:#ec008d\">214</em> s̓as̓ẹdẹli̍n" ), geometry = list( type = "Point", coordinates = list(10.88553927, 46.33220307) ) ), list( type = "Feature", properties = list( punto = 828L, unicode = "u vrəččə͐tíe͐ddə", html = "u vrəčč<sup>ə</sup>tí<sup>e</sup>ddə", label = "<em style=\"color:#ec008d\">828</em> u vrəčč<sup>ə</sup>tí<sup>e</sup>ddə" ), geometry = list( type = "Point", coordinates = list(16.4131601, 41.1534886) ) ), list( type = "Feature", properties = list( punto = 764L, unicode = "perdiǧèd̰ḏ͐a", html = "perdiǧèd̰<sup>d̰</sup>a", label = "<em style=\"color:#ec008d\">764</em> perdiǧèd̰<sup>d̰</sup>a" ), geometry = list( type = "Point", coordinates = list(9.655999729, 39.92658912) ) ), list( type = "Feature", properties = list( punto = NULL, unicode = NULL, html = NULL, label = "<em style=\"color:#ec008d\">NA</em> " ), geometry = list( type = "Point", coordinates = list(14.1635845, 42.347886) ) ), list( type = "Feature", properties = list( punto = 806L, unicode = "pətrəččòla , vrəččo̍dda", html = "pətrəččòla , vrəččo̍dda", label = "<em style=\"color:#ec008d\">806</em> pətrəččòla , vrəččo̍dda" ), geometry = list( type = "Point", coordinates = list(15.63804725, 41.71244172) ) ) ) )
leaf_map <- leaflet() |>
addTiles() |>
setView(14, 43, zoom = 6) |>
onRender(
"function(el, x, geojson) {
window.map = this;
var layer = L.labeler(geojson, {
// In your geoJSON label is stored in the property 'label'
labelProp: 'label',
labelPos: 'auto',
pointToLayer: (gj, ll) => L.circleMarker(ll, {radius: 6})
}).addTo(this);
}",
data = geojson)
ui <- fluidPage(
tags$script(src = "https://samanbey.github.io/leaflet-labeler/leaflet-labeler.js"),
tags$link(rel ="stylesheet", href="https://samanbey.github.io/leaflet-labeler/leaflet-labeler.css"),
leafletOutput("map", height = 900) # give map some height
)
server <- \(input, output, session) output$map = renderLeaflet(leaf_map)
shinyApp(ui, server)
你将得到
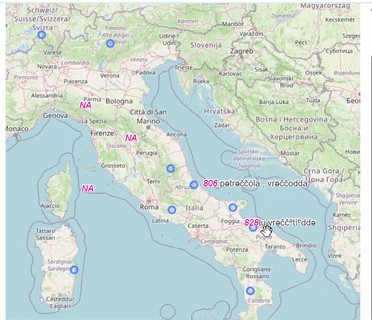
其实看起来好看多了,但GIF的大小限制在1.5 MB以下 :(
站内所有文章版权归属LeftHeroAI导航站,无授权禁止任何主体转载、抄袭、复制内容,亦不得私自架设镜像站点。一经侵权,本站将通过法律途径追责。
相关文章






汇集全球数千款 AI 工具,每日持续更新,配套 AI 开发学习资源,轻松用 AI 提升工作效率。快捷键 Ctrl+D/⌘+D 一键收藏本站。