


当小数位数设为0时,为什么负的Y 轴标签会消失?
我在我的BI项目中使用AmCharts版本3。在处理负值时,我遇到了一个关于Y 轴标签的具体问题。
当我将“小数点后几位”(精度)设为0 时,Y轴上的负标签会完全消失。不过,如果将精度设为1 或2,负标签(如 -1000、-2000)就能完美显示。
观察要点:
- 图表中可见负值柱状图,说明数据传递正确。
- 轴范围设置为“按数据自适应”(自动缩放)。
- 这个问题仅在标签被四舍五入为整数(0位小数)时出现。
- 当标签消失时,负值区域的轴仍然是空白的。
我已经检查了最小值和strictMinMax属性。当精度为0 时,将strictMinMax设为false似乎也无法解决问题。
在AmCharts v3中,是否有某个特定属性会在标签距离坐标轴过近或在被四舍五入时隐藏负值标签?如何确保即使只有0 位小数时标签也始终可见?
我附上两个场景的截图(0小数位vs 2小数位):
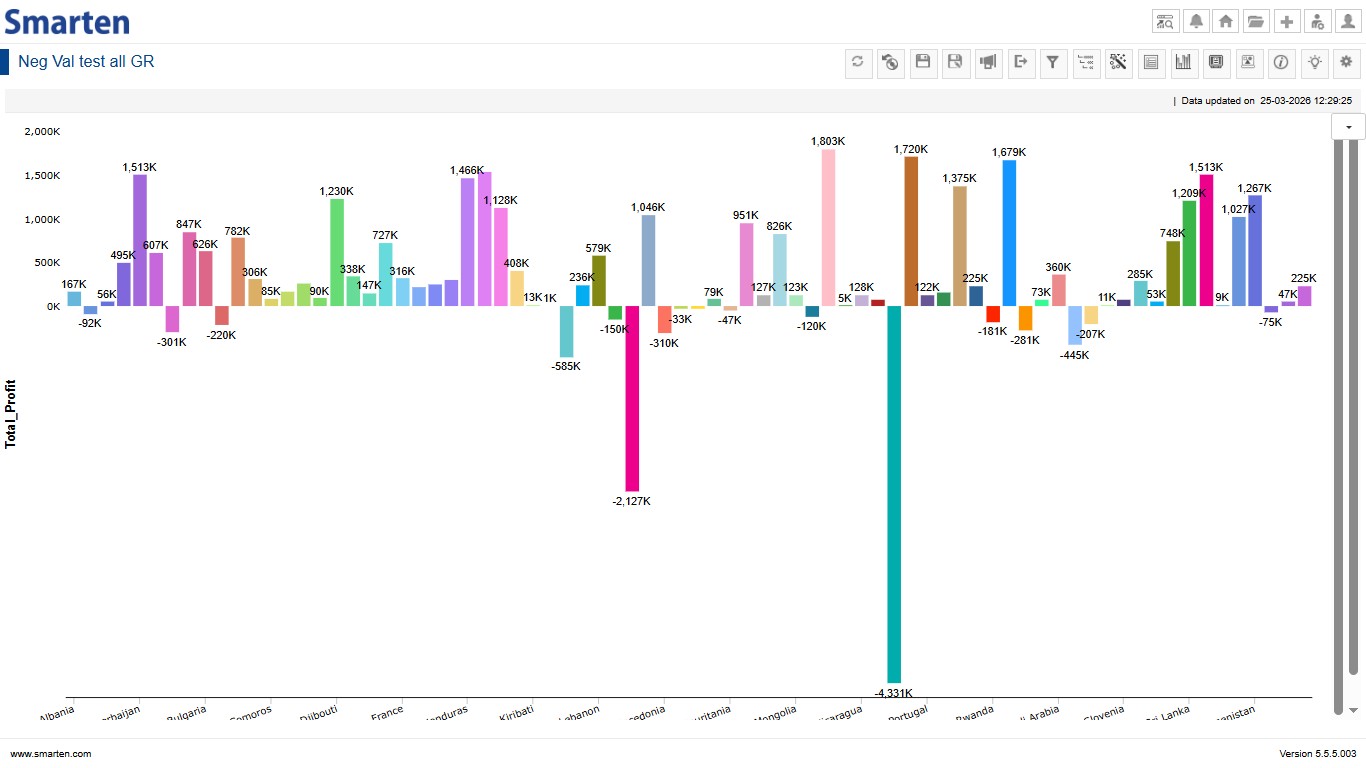
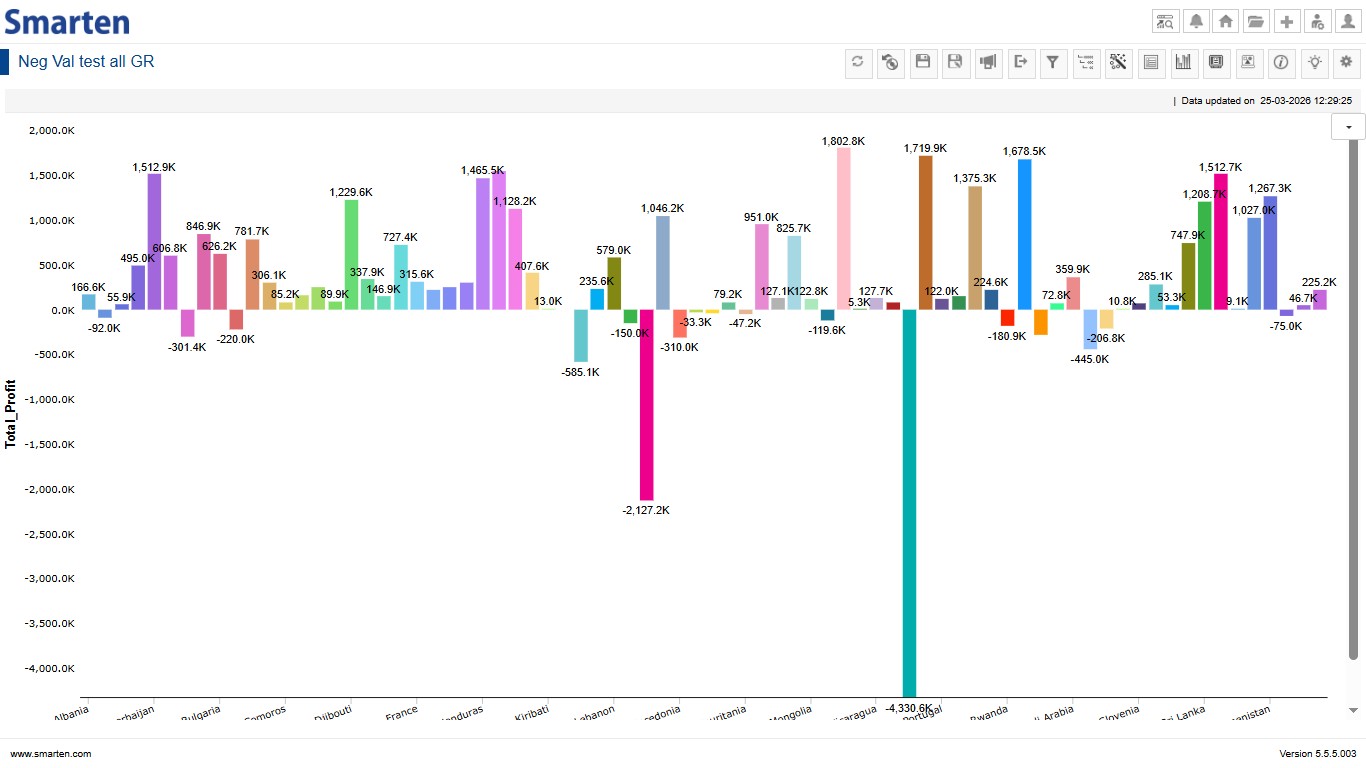
以下是实际的错误示例 - codepen.io/Utkarsh-Patidar-the-scripter/pen/wBzpdEq
     var chartData = [
  { "country": "A", "profit": -1000 },
  { "country": "B", "profit": 1000 }
];

var chart = AmCharts.makeChart("chartdiv", {
  "type": "serial",
  "dataProvider": chartData,

  "valueAxes": [{
    "precision": 0
  }],

  "graphs": [{
    "valueField": "profit",
    "type": "column"
  }],

  "categoryField": "country"
});
解决方案
this happens in AmCharts when precision is set to 0, the library formats labels first and then deduplicates them by default, which is whats causing -0 and 0 to collide and one to be dropped. the fix for v3 is by using a custom labelFunction to handle formatting yourself, and bypassing the built-in precision logic entirely
站内所有文章版权归属LeftHeroAI导航站,无授权禁止任何主体转载、抄袭、复制内容,亦不得私自架设镜像站点。一经侵权,本站将通过法律途径追责。
上一篇
已经不再起作用





