


如何找到Paribu的恐惧与贪婪指数图背后的API端点?
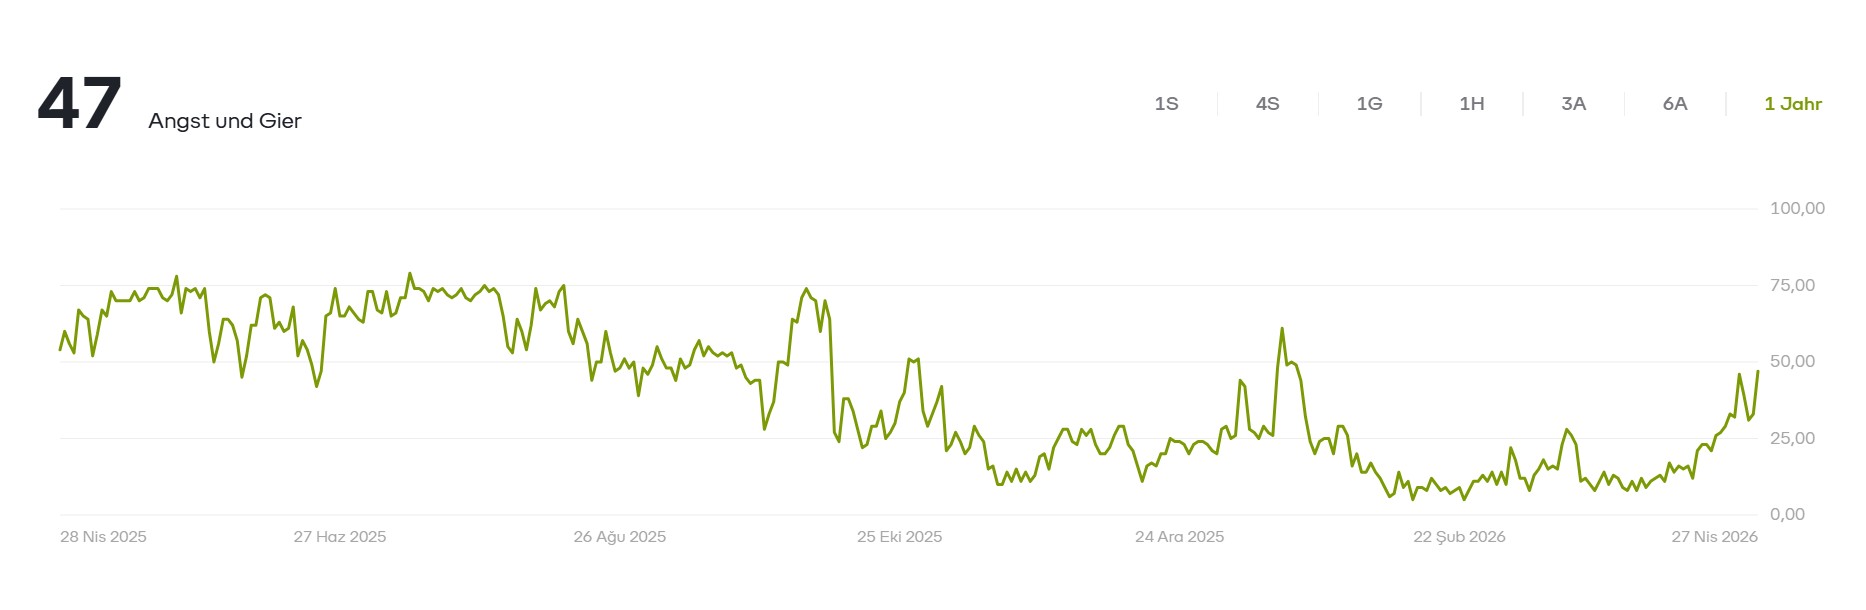
我正在做一个个人项目,需要在Paribu的趋势页上显示的确切恐惧与贪婪指数数值:
https://www.paribu.com/kripto-trend-analizi
该页面显示一个带有1H/4H/1D/1W/3M/6M/1Y标签的图表。
那里显示的数值与alternative.me的公开API不同,因此我必须使用Paribu自己的数据。
本来我以为会有一个单独的API端点,查看页面时我发现整个图表数据集被嵌入在一个 <script id="__NEXT_DATA__" type="application/json"> 标签内。相关路径似乎是:
props.pageProps.fearAndGreed
在其中有一个 history 数组,里面的条目类似于:
{
  "value": 47,
  "timestamp": 1714176000000,
  "classification": "korku"
}
解决方案
The Fear-and-Greed-chart-script fng_chart.js 使用 window.__FNG_HISTORY__。
你可以通过Browsertools F12 -> ctrl + F 在位于 <script nonce>-标签中的元素内找到该数据(xpath="/html/body/main/script[1]"):
一个辅助函数通过 regex 提取给定变量后的JSON,匹配 {} 或 [] 的内容。
library(httr2)

html <- request("https://www.paribu.com/kripto-trend-analizi") |>
  req_perform() |>
  resp_body_string()

ex_json <- \(text, var) {
  pattern <- paste0("window\\.", var, " =(\\{.*?\\}|\\[.*?\\]);")
  matches <- regexec(pattern = pattern, text = text)
  do.call(rbind, regmatches(x = text, m = matches))[, 2] |>
    jsonlite::fromJSON()
}

market_map  <- ex_json(html, "__MARKET_MAP__") |>
  do.call(rbind, args=_) |> as.data.frame()
quote_rates2 <- ex_json(html, "__QUOTE_RATES__") |>
  stack() |> setNames(nm=c('rate', 'symbol')) # courtesy of @Friede
fng_history <- ex_json(html, "__FNG_HISTORY__") |>
  transform(date = as.POSIXct(t))

library(ggplot2)
# Courtesy of @Jon Spring you can create a plot closer to the original
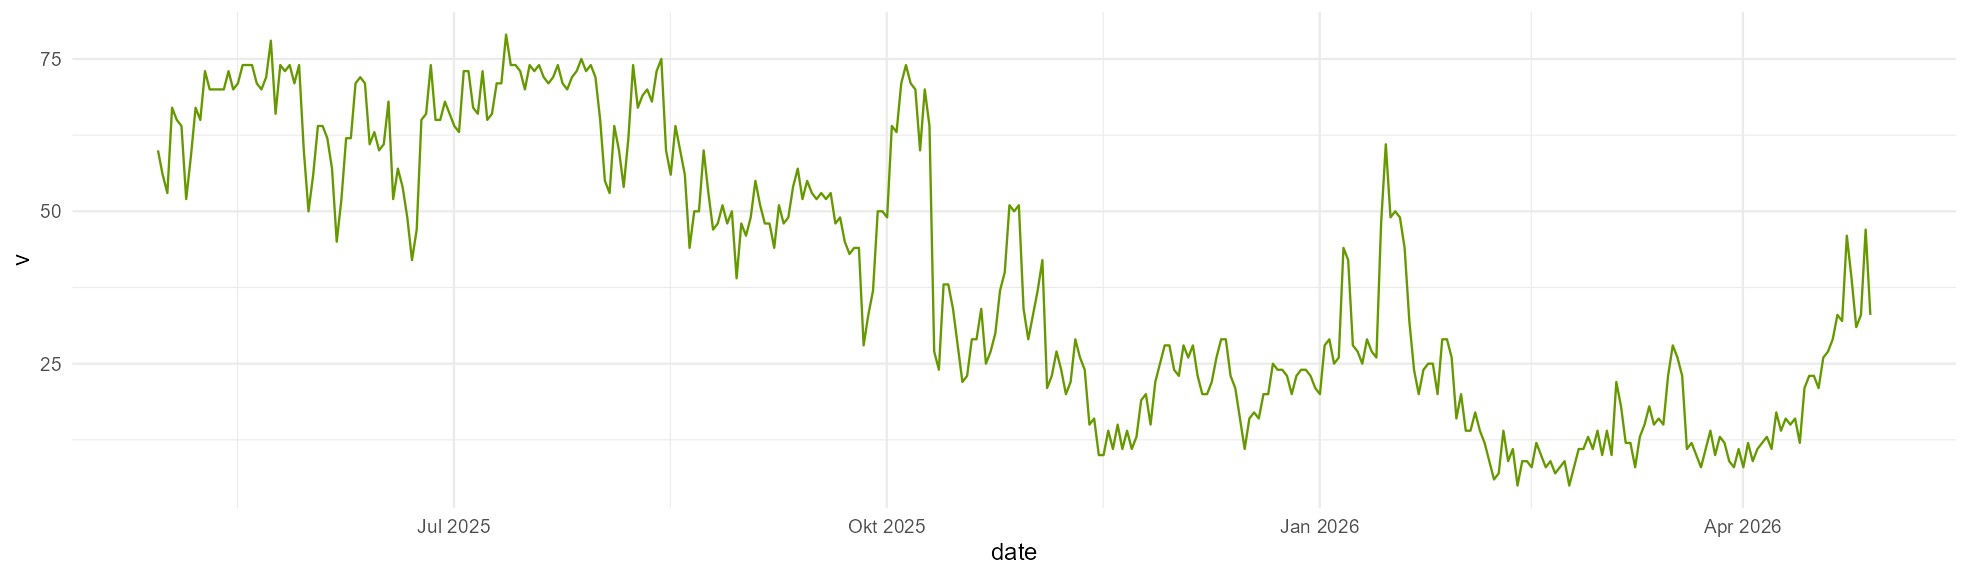
ggplot(data=fng_history, aes(x=date, y=v)) +
  geom_line(color = "#690") +
  scale_y_continuous(breaks = scales::breaks_width(25)) +
  theme_minimal()
 相比之下
相比之下
站内所有文章版权归属LeftHeroAI导航站,无授权禁止任何主体转载、抄袭、复制内容,亦不得私自架设镜像站点。一经侵权,本站将通过法律途径追责。
相关文章






汇集全球数千款 AI 工具,每日持续更新,配套 AI 开发学习资源,轻松用 AI 提升工作效率。快捷键 Ctrl+D/⌘+D 一键收藏本站。