


为什么 `as.logical()` 比 `logical(0)` 快得多?
as.logical() returns a logical(0):
as.logical()
#> logical(0)
但我很惊讶地发现 logical(0) 比 as.logical() 要慢得多。这是为什么呢?对于其他 as.*() 函数也是如此:
bench::mark(as.logical(), logical(0), iterations = 1e5)
#> # A tibble: 2 × 6
#>   expression        min   median `itr/sec` mem_alloc `gc/sec`
#>   <bch:expr>   <bch:tm> <bch:tm>     <dbl> <bch:byt>    <dbl>
#> 1 as.logical()   48.1ns     76ns  8467061.        0B      0
#> 2 logical(0)      468ns    571ns  1541503.        0B     30.8
bench::mark(as.character(), character(0), iterations = 1e5)
#> # A tibble: 2 × 6
#>   expression          min   median `itr/sec` mem_alloc `gc/sec`
#>   <bch:expr>     <bch:tm> <bch:tm>     <dbl> <bch:byt>    <dbl>
#> 1 as.character()     65ns   94.1ns  9734069.        0B      0
#> 2 character(0)      505ns    593ns  1550503.        0B     15.5
bench::mark(as.numeric(), numeric(0), iterations = 1e5)
#> # A tibble: 2 × 6
#>   expression        min   median `itr/sec` mem_alloc `gc/sec`
#>   <bch:expr>   <bch:tm> <bch:tm>     <dbl> <bch:byt>    <dbl>
#> 1 as.numeric()   58.1ns     91ns 10218252.        0B      0
#> 2 numeric(0)      500ns    561ns  1622768.        0B     16.2
bench::mark(as.integer(), integer(0), iterations = 1e5)
#> # A tibble: 2 × 6
#>   expression        min   median `itr/sec` mem_alloc `gc/sec`
#>   <bch:expr>   <bch:tm> <bch:tm>     <dbl> <bch:byt>    <dbl>
#> 1 as.integer()     64ns     92ns  9863536.        0B      0
#> 2 integer(0)      469ns    582ns  1435752.        0B     14.4
解决方案
.Internal() 函数的开销要比 .Primitive() 大。
logical() 的主体是:
.Internal(vector("logical", length))
而 as.logical() 是一个 原始类型,定义为:
.Primitive("as.logical")
请注意,.Internal() 本身也是一个原始函数,但它被一个标准的R 函数包装着——这是根本的区别:
is.primitive(logical)
# [1] FALSE
is.primitive(as.logical)
# [1] TRUE
在R Internals Manual的 [.Internal vs .Primitive] 部分,它写道:
使用
.Internal()并封装在闭包中的函数通常更受偏好,因为这可以确保对带名参数和默认参数的标准处理……在使用被函数闭包包装的.Internal接口时,确实会有一些开销
开销是什么?
由于我们在比较一个 .Primitive 与一个 .Internal,有很多差异发生在C 层,因此我运行了带符号表的R 的 调试版本,并用 Valgrind 做了分析:
valgrind --tool=callgrind --trace-children=yes --callgrind-out-file=callgrind-logicalzero.out Rscript --vanilla -e "for(i in 1:1e7) logical(0)"
valgrind --tool=callgrind --trace-children=yes --callgrind-out-file=callgrind-as.logical.out Rscript --vanilla -e "for(i in 1:1e7) as.logical()"
随后我用 [callgrind] 获取了函数调用列表及其占总时间的百分比。以下是两者的前五行:
Output for as.logical():
2,225,301,557 (23.34%)  ./src/main/./src/main/eval.c:bcEval_loop [/usr/lib/R/lib/libR.so]
  931,749,167 ( 9.77%)  ./src/main/./src/main/memory.c:Rf_allocVector3 [/usr/lib/R/lib/libR.so]
  799,330,174 ( 8.38%)  ???:0x0000000000a16ce0 [/usr/lib/x86_64-linux-gnu/openblas-pthread/libopenblasp-r0.3.32.so]
  720,038,510 ( 7.55%)  ./src/main/./src/main/coerce.c:do_asatomic [/usr/lib/R/lib/libR.so]
  490,428,238 ( 5.14%)  ./src/main/./src/main/coerce.c:Rf_coerceVector [/usr/lib/R/lib/libR.so]
Output for logical(0):
5,635,442,218 (17.74%)  ./src/main/./src/main/eval.c:bcEval_loop [/usr/lib/R/lib/libR.so]
2,278,455,493 ( 7.17%)  ./src/main/./src/main/match.c:Rf_matchArgs_NR [/usr/lib/R/lib/libR.so]
2,204,920,217 ( 6.94%)  /build/reproducible-path/glibc-2.42/string/../sysdeps/x86_64/multiarch/strcmp-avx2.S:__strcmp_avx2 [/usr/lib/x86_64-linux-gnu/libc.so.6]
1,734,012,789 ( 5.46%)  ./src/main/./src/main/eval.c:setup_bcframe_call [/usr/lib/R/lib/libR.so]
1,405,204,563 ( 4.42%)  ./src/main/./src/main/memory.c:CONS_NR [/usr/lib/R/lib/libR.so]
1,260,649,520 ( 3.97%)  ./src/main/./src/main/util.c:Rf_str2type [/usr/lib/R/lib/libR.so]
对输出的解析
完整的 logical(0) 运行大约执行了318亿条指令,而 as.logical() 大约为95亿条。值得关注的部分在于这些额外指令的去处。
第一个显著的差异是在循环之后(bcEval_loop),该循环分别占 logical(0) 运行的17.7% 和 as.logical() 运行的23.3%。在比较两次运行时,callgrind 的输出中的百分比略有误导,因为它们是基于截然不同的总量的比例。就绝对指令数而言,bcEval_loop 对 logical(0) 的指令约为56.4亿条,对 as.logical() 的指令约为22.3亿条。
对 as.logical() 来说,接下来最耗时的任务其实是分配向量(Rf_allocVector3),而对于 logical(0) 来说,这甚至不在前五名。
绘制绝对指令计数可以让这一切更加清晰:
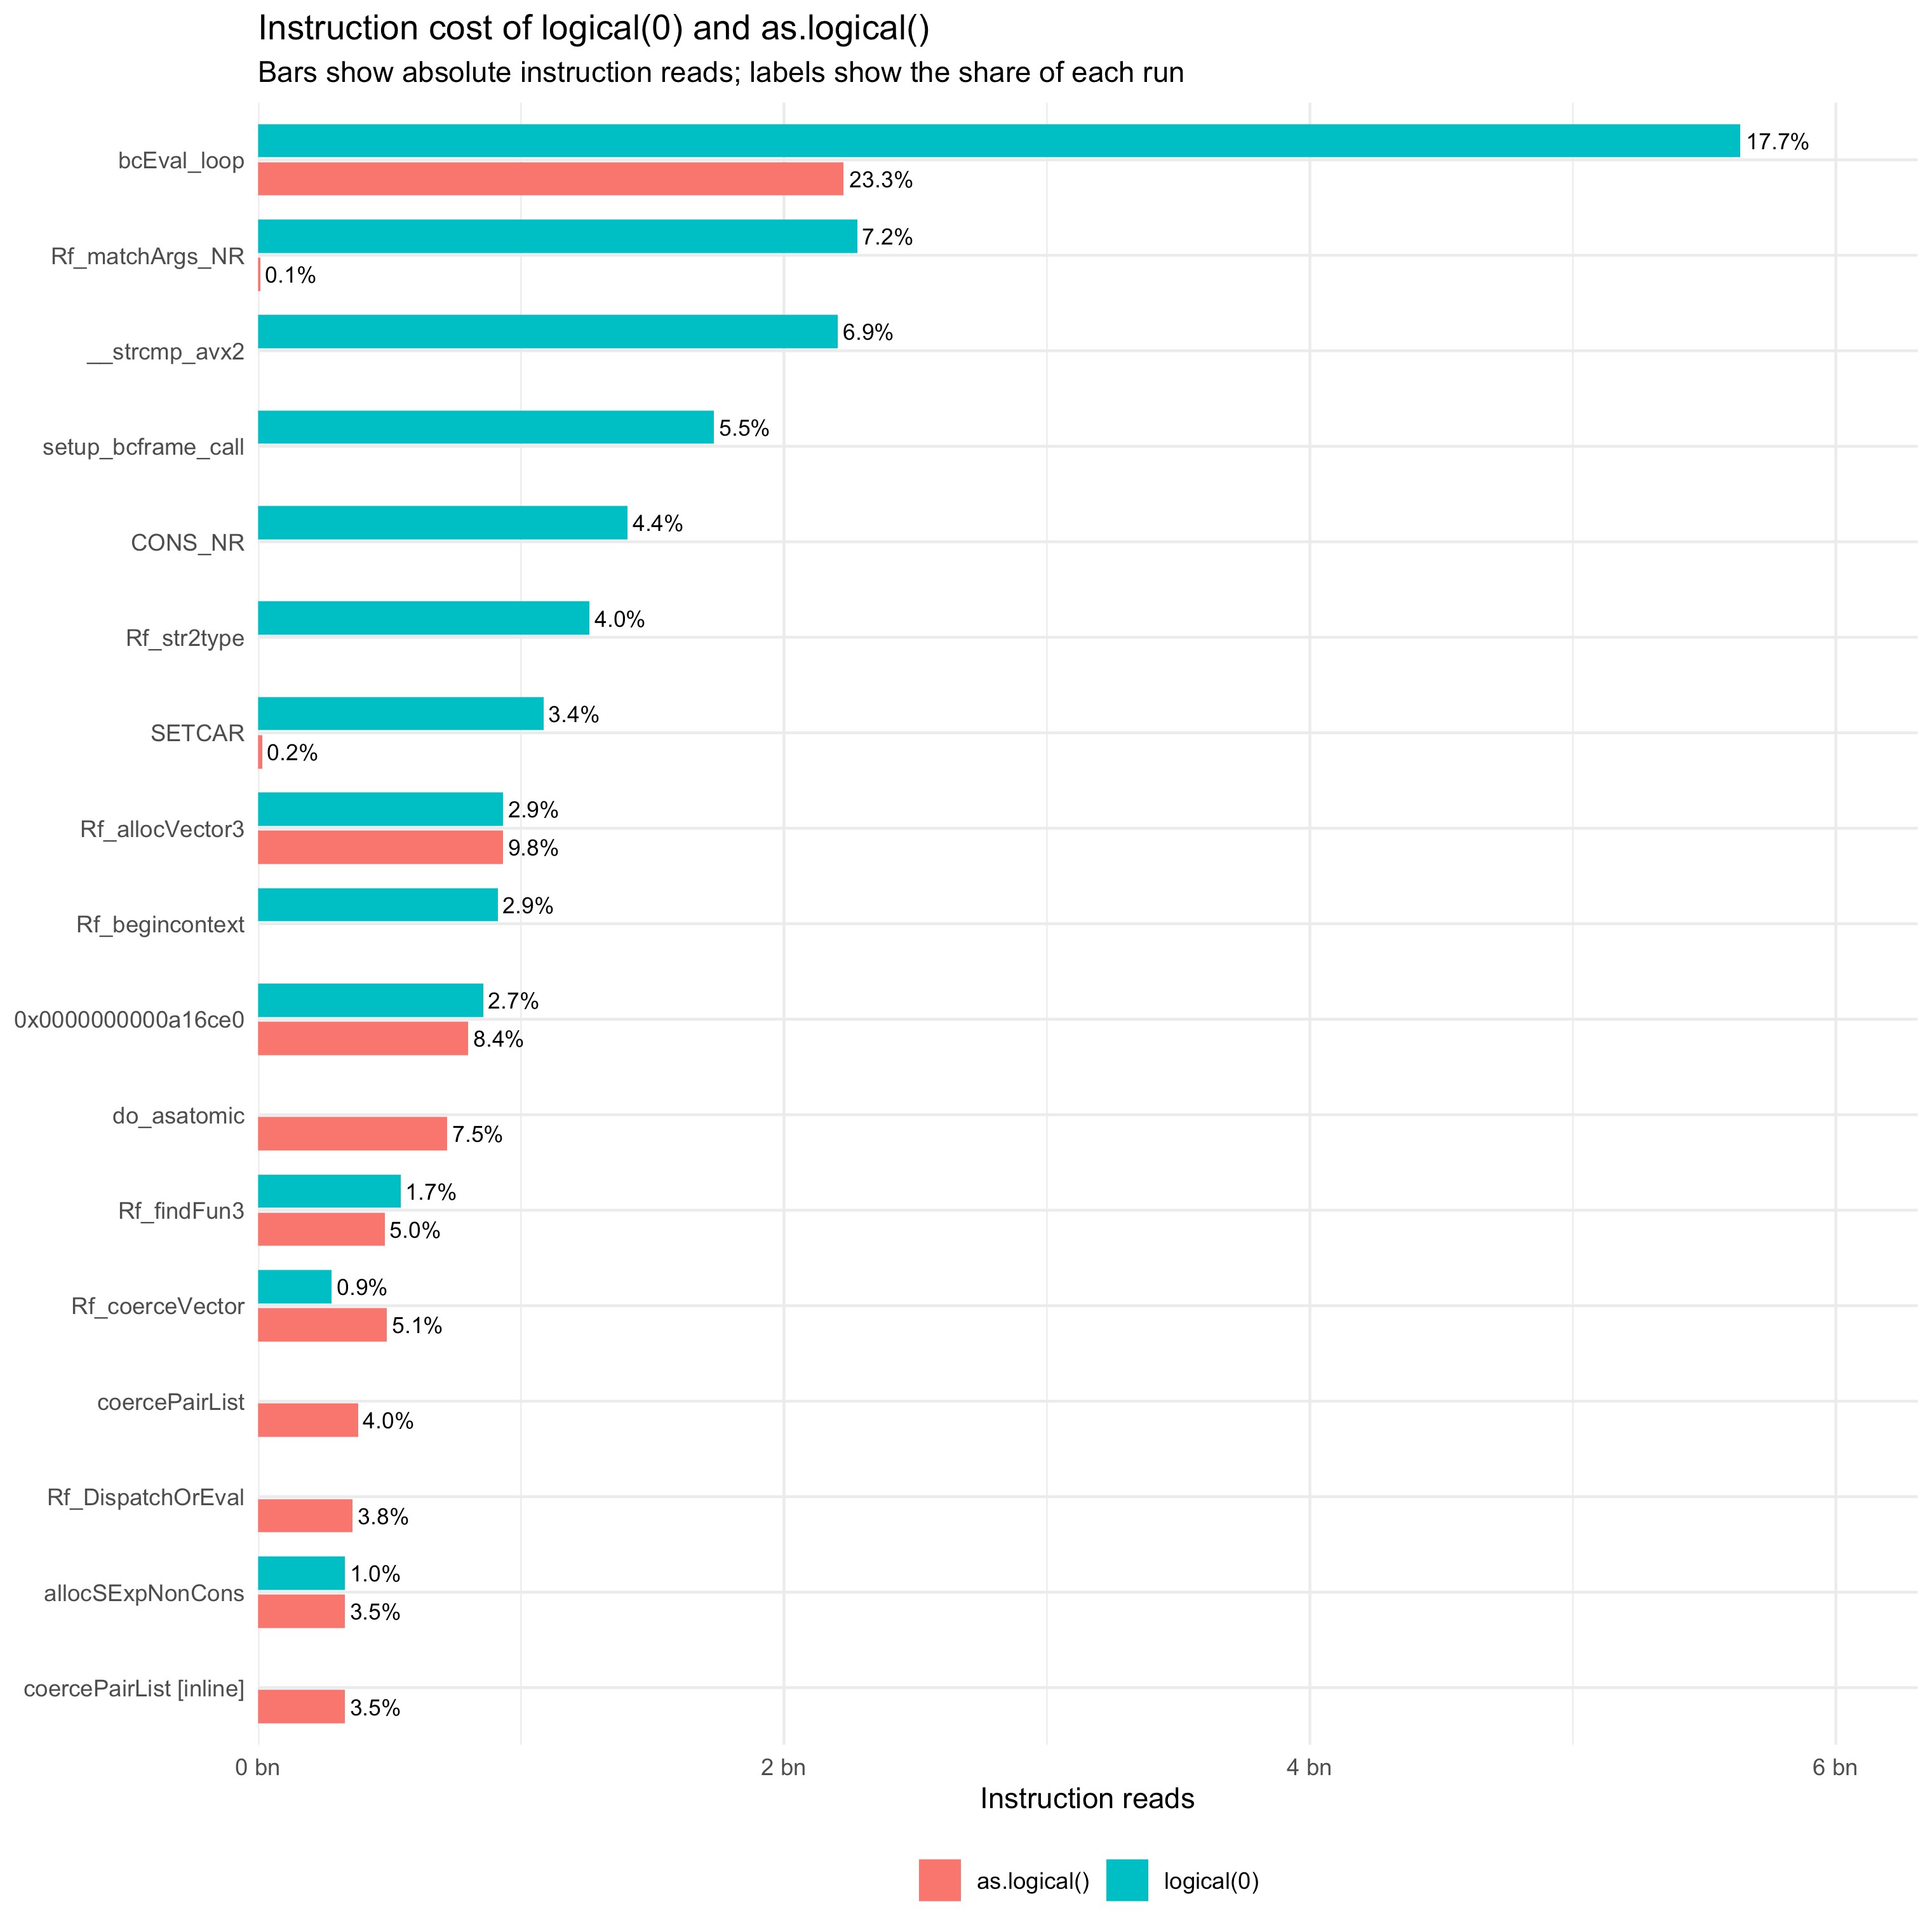
正如你所怀疑的,Rf_allocVector3,负责分配结果向量,在两次运行中几乎占用完全相同数量的指令:
logical(0)    931,811,539
as.logical()  931,749,167
匹配参数并非免费
当你调用 logical(0) 时,你是在向函数提供一个参数。这一次调用(Rf_matchArgs_NR)是在循环之后最耗时的。
在 logical() 的函数体中还有字符串 "logical":
.Internal(vector("logical", length))
R通过在类型名表中搜索并用 Rf_str2type 与 __strcmp_avx2 的调用逐个比较来将其转换为内部的 LGLSXP 类型代码,而这一步 as.logical() 不需要执行。
环境创建与销毁成本高
调用 logical(0) 需要对一个R 闭包进行求值。R必须匹配参数、建立字节码调用帧、创建调用环境并在到达内部向量构造函数之前对包装器进行求值。
这些额外的工作会直接在分析结果中体现。对于 logical(0),有些函数要么更加耗时,要么只有在特定场景才会显著出现,包括:
Rf_matchArgs_NR
setup_bcframe_call
CONS_NR
SETCAR
Rf_begincontext
Rf_NewEnvironment
make_applyClosure_env
as.logical(),另一方面,避免了调用R 闭包所需的环境创建与设置成本。
这解释了你在 bench::mark() 输出中的垃圾回收结果。logical(0) 在设置和求值闭包时会创建更多的临时对象,包括调用结构和环境,随后这些对象必须被回收。
补充:使用 valgrind 作为分析器
我在这里使用 valgrind,部分原因是想了解C 语言层和R 语言层在做什么,同时因为时间差如此微小(每秒约800万次迭代!),我对 [profvis] 能否处理它不太有信心。下面是我非常快速粗暴的做法——前提是你已经安装了 [Docker]。
# create a (self-destroying) container
docker run -it --rm --security-opt seccomp=unconfined --name r-callgrind rocker/r-base bash

# then inside the container install Valgrind and the debug symbol package
echo "deb http://deb.debian.org/debian-debug unstable-debug main" > /etc/apt/sources.list.d/debug.list
apt-get update
apt-get install -y valgrind r-base-core-dbgsym

# run the profiling
valgrind --tool=callgrind --trace-children=yes --callgrind-out-file=callgrind-logicalzero.out Rscript --vanilla -e "for(i in 1:1e7) logical(0)"
valgrind --tool=callgrind --trace-children=yes --callgrind-out-file=callgrind.as.logical.out Rscript --vanilla -e "for(i in 1:1e7) as.logical()"

# to get the results in a nice format with only the lines we want
callgrind_annotate  --auto=no  --inclusive=no callgrind-logicalzero.out | awk '/file:function/{flag=1; getline; next} flag' > logical-zero.txt
callgrind_annotate  --auto=no  --inclusive=no callgrind.as.logical.out | awk '/file:function/{flag=1; getline; next} flag' > as-logical.txt
然后在R 中将输出放入数据框(在容器仍在运行时执行):
# Extract the formatted files from the container
commands <- c("logical-zero", "as-logical")
sprintf("docker cp r-callgrind:/%s.txt .", commands)  |>
    sapply(system) # you can also run this in bash rather than R

read_callgrind <- function(command) {
    path <- sprintf("%s.txt", command)
    # horrible regex to match lines that look like
    # 5,635,442,218 (17.74%)  ./src/main/./src/main/eval.c:bcEval_loop [/usr/lib/R/lib/libR.so]
    pattern <- "^\\s*([0-9,]+)\\s+\\(\\s*([0-9.]+)%\\)\\s+(.+?):([^[:space:]]+)"
    proto <- data.frame(
        instructions = character(),
        share = numeric(),
        source = character(),
        function_name = character()
    )

    strcapture(pattern, readLines(path), proto)  |>
    dplyr::mutate(
        instructions = as.numeric(gsub(",", "", instructions)),
    )
}

results <- lapply(setNames(commands, commands), read_callgrind)  |>
    dplyr::bind_rows(.id = "benchmark")

# This gives you something like:
#   benchmark    instructions share source                           function_name
#   <chr>               <dbl> <dbl> <chr>                            <chr>
# 1 logical-zero   5635442218 17.7  ./src/main/./src/main/eval.c     bcEval_loop
# 2 logical-zero   2278455493  7.17 ./src/main/./src/main/match.c    Rf_matchArgs…
# 3 logical-zero   2204920217  6.94 /build/reproducible-path/glibc-… __strcmp_avx2
# 4 logical-zero   1734012789  5.46 ./src/main/./src/main/eval.c     setup_bcfram…
# 5 logical-zero   1405204563  4.42 ./src/main/./src/main/memory.c   CONS_NR
# 6 logical-zero   1260649520  3.97 ./src/main/./src/main/util.c     Rf_str2type
我想,对于对R 内部工作原理感兴趣并走到这一步的人,将会非常熟练地对数据进行拆分与分析。
相关文章





