


对称对数尺度中的负号缺失
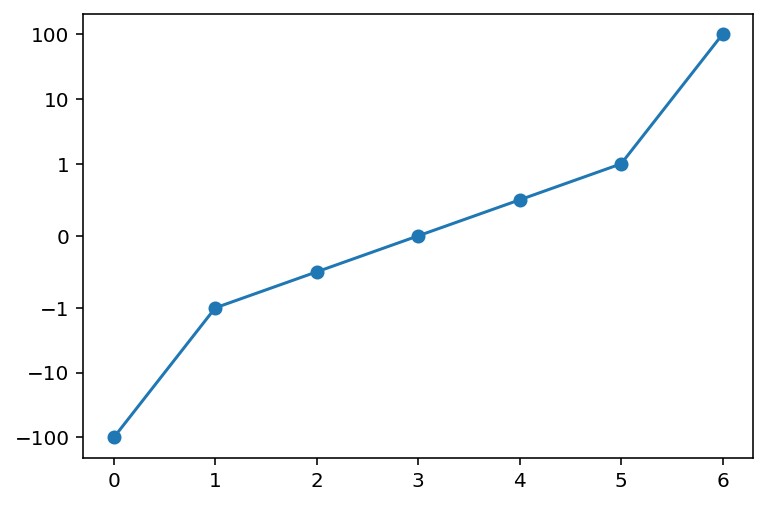
我有如下图,使用对称对数刻度:
from matplotlib import pyplot as plt
from matplotlib import ticker
(_, ax) = plt.subplots()
ax.plot([-100, -1, -0.5, 0, 0.5, 1, 100], marker='o')
ax.set_yscale('symlog', linthresh=1)
ax.yaxis.set_major_formatter(ticker.LogFormatter(linthresh=1))
![数据的一个图。y 轴标签为 [100, 10, 1, 0, 1, 10, 100]。](/uploadfile/blog2026/7c2326cd1af243c48ee0ce9a701b984b.jpg)
我强制让y 轴标签使用标准记法(非科学记数法),但请注意负y 轴上的标签没有负号。该如何修正?
解决方案
Your use of LogFormatter on the y axis actually seems to cause the problem in my opinion: Looking at the source code of it (in particular, line 1013), the LogFormatter simply takes the absolute value of each provided value and then never recovers the sign (it calls self.fix_minus(s) on return, but this is just a correction for "typographically correct" minus signs – which does not have any effect here, since the minus signs have been suppressed before; see above).
Simply using ticker.ScalarFormatter() instead of ticker.LogFormatter(linthresh=1) does seem to fix it for me, however:
完整代码:
from matplotlib import pyplot as plt
from matplotlib import ticker

_, ax = plt.subplots()
ax.plot([-100, -1, -0.5, 0, 0.5, 1, 100], marker="o")
ax.set_yscale("symlog", linthresh=1)
ax.yaxis.set_major_formatter(ticker.ScalarFormatter())
站内所有文章版权归属LeftHeroAI导航站,无授权禁止任何主体转载、抄袭、复制内容,亦不得私自架设镜像站点。一经侵权,本站将通过法律途径追责。
相关文章






汇集全球数千款 AI 工具,每日持续更新,配套 AI 开发学习资源,轻松用 AI 提升工作效率。快捷键 Ctrl+D/⌘+D 一键收藏本站。