


使用RavenR包中的rvn_budyko_plot函数在布迪科曲线上绘制数据未成功
在RStudio中,R版本4.3.1,使用 "RavenR" 生成包含我自己数据的Budyko图。
我有蒸散发、降水和潜在蒸散发的逐年数值,据此我计算干旱度和蒸散指数。我想把这些画到rvn_budyko_plot生成的Budyko图中。然而,R提示我的命名有问题。我已经尽量确保命名符合该包的约定,当我用 "names()" 检查时,它们也符合。通过移除2013,我就移除了数据中的所有NA。我尝试将日期格式化为as.POSIXct和 as.Date。
Budyko_data <- dataset %>%
  group_by(Year = as.POSIXct(format(Date, "%Y-%01-01"), tz = "UTC")) %>%
  summarise(
    AET= sum(ET, na.rm = TRUE),
    PRECIP= sum(P_F, na.rm = TRUE),
    PET= sum(ETPot, na.rm = TRUE))
Budyko_data$Date <- as.Date(Budyko_data$Date)

# Calculate evaporative Index # ET / PRECIP
Budyko_data$Evaporative_ind <- Budyko_data$AET/ Budyko_data$PRECIP

# calculate Aridity index # PET/ PRECIP
Budyko_data$Aridity_ind <- Budyko_data$PET/ Budyko_data$PRECIP
计算完成后我把它们转成可扩展的时间序列对象,遵循该包的命名约定
# generating extensible time series objects to fit "x" and "x_indices"
budyko1 <- Budyko_data %>%
  filter(year(Date) != 2013)%>%
  mutate(
    Date= Date,
    PET= PET,
    AET= AET,
    PRECIP= PRECIP
  ) %>%
  select(Date, PET, AET, PRECIP)
x <- as.xts(budyko1)

budyko2 <-Budyko_data %>%
  filter(year(Date) != 2013) %>%
  mutate(
    Date= Date,
    ARIDITY= ARIDITY,
    EVAPORATION= EVAPORATION)%>%
  select(Date, ARIDITY, EVAPORATION)
x_indices <- as.xts(budyko2)

# plotting the data
rvn_budyko_plot(x, x_indices,limiting_labels = TRUE, budyko_curve = TRUE, mm = 9, d = 30)
然而我得到的是
#"Fehler in if (c("PET", "AET", "PRECIP") %notin% names(x_indices)) { :  Bedingung hat Länge > 1"
# Mistake in if(c("PET", "AET", "PRECIP") %notin% names(x_indices)) {: condition has length >1
如果我不添加自己的数据,我就能正常绘制曲线。我到底做错了什么?我该如何修正我的代码?
我想把我自己的干旱度和蒸散指数绘制到Budyko图中。
这是我的数据:
 Date         AET PRECIP   PET Year  EVAPORATION ARIDITY
   <date>     <dbl>  <dbl> <dbl> <fct>       <dbl>   <dbl>
 1 2014-01-01  244.   297. 553.  2014        0.824   1.86
 2 2015-01-01  173.   328. 394.  2015        0.529   1.20
 3 2016-01-01  200.   280. 471.  2016        0.716   1.68
 4 2017-01-01  231.   360. 319.  2017        0.642   0.886
 5 2018-01-01  288.   220.  66.5 2018        1.31    0.303
 6 2019-01-01  201.   224. 390.  2019        0.897   1.74
 7 2020-01-01  261.   397. 402.  2020        0.658   1.01
 8 2021-01-01  298.   515. 419.  2021        0.580   0.814
 9 2022-01-01  286.   404. 333.  2022        0.709   0.825
10 2023-01-01  308.   298. 394.  2023        1.04    1.32
11 2024-01-01  290.   422. 372.  2024        0.687   0.882
解决方案
我认为在不本地修复包本身的情况下无法真正“修复”这个错误。这并不困难,但也不是许多R 用户常用的排错步骤的一部分。我来带你看看对我有用的做法。
两个问题:
- 包里有一个错误。我认为它应该是
!any(..)。 - 在
x_indices数据中,该函数在寻找EVAPORATIVE而不是EVAPORATION(尽管有文档)。
Bug #1,修复包
自上次CRAN发布以来,似乎有几次提交。我对这个包及其功能了解不够,无法判断它们是否关键或是否经过充分测试。如果你愿意这样做(我在这里用过它),请前往 https://github.com/rchlumsk/RavenR,然后选择 "Code >> Download Zip"(解压到本地目录),或 git clone 将仓库克隆到本地。
之后,用以下差异修改 R/rvn_budyko_plot.R(移除以 - 开头的那一行,用以 + 开头的行替换):
--- a/R/rvn_budyko_plot.R
+++ b/R/rvn_budyko_plot.R
@@ -76,7 +76,7 @@ rvn_budyko_plot <- function(x=NULL, x_indices=NULL, limiting_labels=FALSE, budyk
       stop("rvn_budyko_plot: x_indices should be of class xts")
     }
     names(x_indices) <- toupper(names(x_indices))
-    if (c("PET","AET","PRECIP") %notin% names(x_indices)) {
+    if (!any(c("PET","AET","PRECIP") %notin% names(x_indices))) {
       stop(sprintf("rvn_budyko_plot: x_indices should contain columns for ARIDITY and EVAPORATIVE;\nNissing columns for %s",
                    c("ARIDITY","EVAPORATIVE")[which(c("ARIDITY","EVAPORATIVE") %notin% names(x_indices))] ))
     }
有多种方式来编译和安装这样的本地包目录,最简单的方法是在系统中尚未安装 devtools 包时先安装它,然后运行 devtools::load_all("path/to/RavenR")(每次启动R 都需要重新执行)或 devtools::install("path/to/RavenR")(在本地计算机的每个R 会话中都能工作)。
Bug #2,修复列名
如果你现在运行代码,你会看到
library(dplyr)
library(xts)
library(lubridate)
library(RavenR)

# ...

rvn_budyko_plot(x, x_indices,limiting_labels = TRUE, budyko_curve = TRUE, mm = 9, d = 30)
# Warning in rvn_budyko_plot(x, x_indices, limiting_labels = TRUE, budyko_curve = TRUE,  :
#   rvn_budyko_plot: both indices and raw data supplied with both x_indices and x; only the supplied indices will be used.
# Error in `geom_point()`:
# ! Problem while setting up geom.
# ℹ Error occurred in the 5th layer.
# Caused by error in `compute_geom_1()`:
# ! `geom_point()` requires the following missing aesthetics: y.
# Run `rlang::last_trace()` to see where the error occurred.
查看 R/rvn_budyko_plot.R 里的代码,虽然帮助文档说要使用 EVAPORATION,但代码本身使用的是 EVAPORATIVE:
    p1 <- p1 +
      geom_point(data=x_indices, aes(x=ARIDITY, y=EVAPORATIVE))
事实上,在函数的不同部分也会使用这两种形式,因此我不清楚哪一种更规范或一致。这很可能也是另一个错误(至少在文档中),但让它运行的修复是把你的 x_indices 改成使用后者。
budyko2 <- Budyko_data %>%
  filter(year(Date) != 2013) %>%
  # mutate(..) %>% # this code is doing nothing, safe to keep or remove
  select(Date, ARIDITY, EVAPORATIVE = EVAPORATION) # change
x_indices <- as.xts(budyko2)

rvn_budyko_plot(x, x_indices,limiting_labels = TRUE, budyko_curve = TRUE, mm = 9, d = 30)
# Warning in rvn_budyko_plot(x, x_indices, limiting_labels = TRUE, budyko_curve = TRUE,  :
#   rvn_budyko_plot: both indices and raw data supplied with both x_indices and x; only the supplied indices will be used.
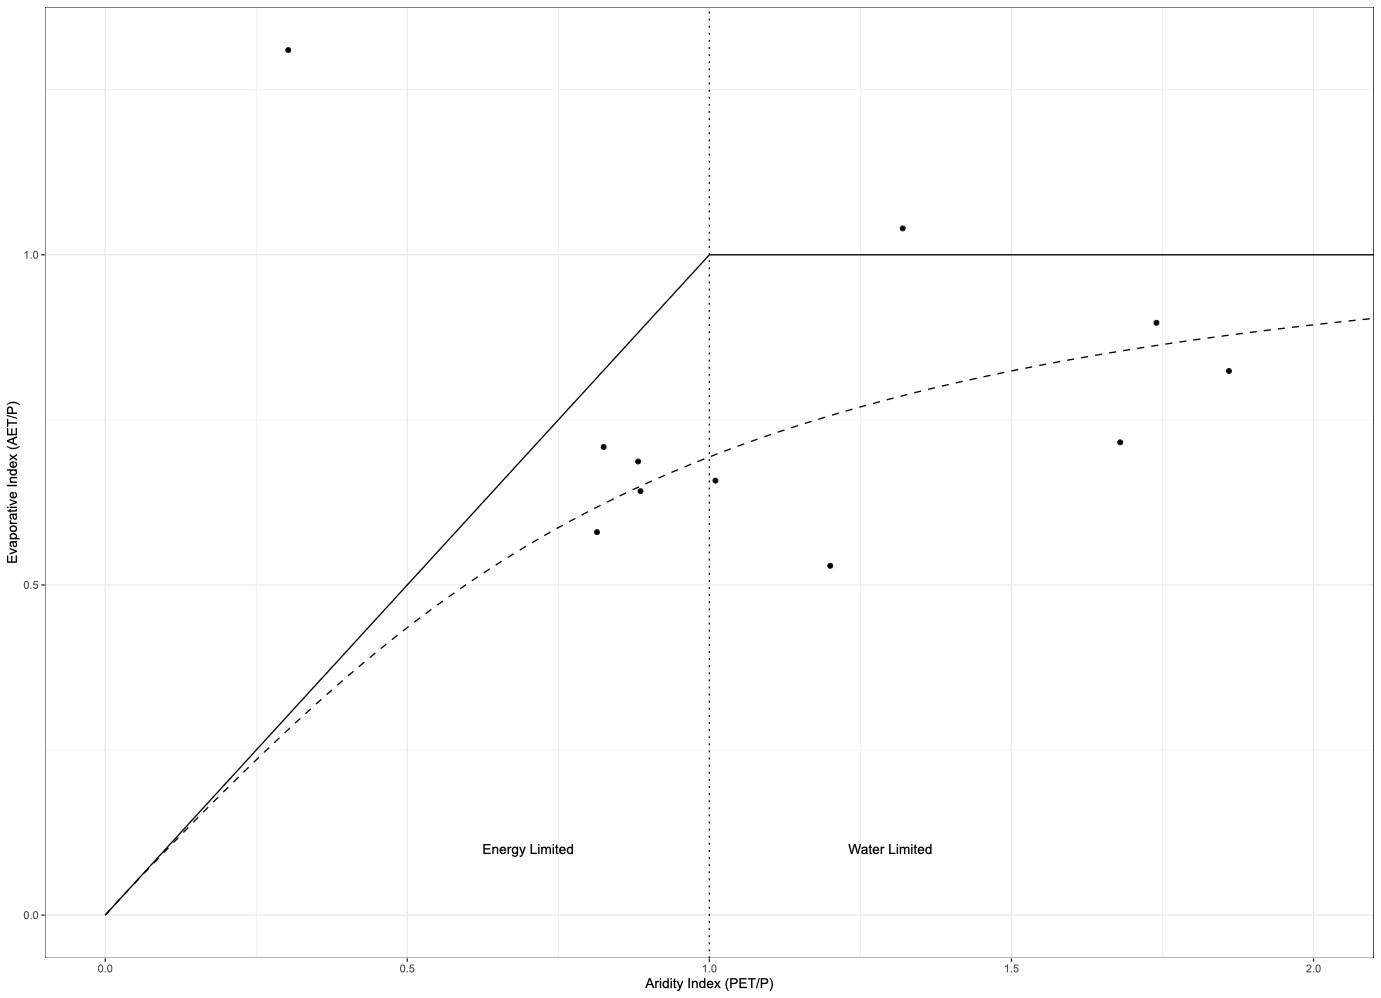
(我不确定这个警告对你是否构成问题,我这里只是在修复代码 :-))
同样地,我认为这两点都应该向维护者提交 Bug报告。
数据:
Budyko_data <- structure(list(
    Date = structure(c(16071, 16436, 16801, 17167, 17532, 17897, 18262, 18628, 18993, 19358, 19723), class = "Date"),
    AET = c(244, 173, 200, 231, 288, 201, 261, 298, 286, 308, 290),
    PRECIP = c(297, 328, 280, 360, 220, 224, 397, 515, 404, 298, 422),
    PET = c(553, 394, 471, 319, 66.5, 390, 402, 419, 333, 394, 372),
    Year = 2014:2024,
    EVAPORATION = c(0.824, 0.529, 0.716, 0.642, 1.31, 0.897, 0.658, 0.58, 0.709, 1.04, 0.687),
    ARIDITY = c(1.86, 1.2, 1.68, 0.886, 0.303, 1.74, 1.01, 0.814, 0.825, 1.32, 0.882),
    Evaporative_ind = c(0.821548821548822, 0.527439024390244, 0.714285714285714, 0.641666666666667, 1.30909090909091, 0.897321428571429, 0.65743073047859, 0.578640776699029, 0.707920792079208, 1.03355704697987, 0.687203791469194),
    Aridity_ind = c(1.86195286195286, 1.20121951219512, 1.68214285714286, 0.886111111111111, 0.302272727272727, 1.74107142857143, 1.01259445843829, 0.813592233009709, 0.824257425742574, 1.32214765100671, 0.881516587677725)
  ), row.names = c("1", "2", "3", "4", "5", "6", "7", "8", "9", "10", "11"), class = "data.frame")
相关文章





