


ggplot无法生成图形?
给定我的时间序列数据,我想绘制折线图,但下面的脚本既没有报错也没有生成图形。
需要帮助。我在类似问题的帖子中也找不到解决办法。
dataset = read.csv("FC120.csv", header=T,
                   colClasses = c("numeric", "numeric", "numeric"))
head(dataset,5)
date_int <- dataset$Date
x = as.Date(as.character(date_int), format = "%Y%m%d")
head(x, 5)

# install.packages("ggplot2")
library(ggplot2)

#Create the plot using ggplot() and geom_line().
ggplot(dataset, aes(x = x, y = TminFc)) +
  geom_line(color = "red", lwd = 1) +
  labs(title = "WRF 5-d Tmin forecast",
       x = "Date",
       y = "Temp (C)") +
  theme_minimal() +
  # Customize x-axis labels
  #scale_x_date(date_labels = "%b %Y", date_breaks = "5 days") This gives error
Date,TminFc,TminOb
 20260201, 17.8, 13.0
 20260202, 17.2, 12.6
 20260203, 17.8, 13.5
 20260204, 18.0, 12.9
 20260205, 16.2, 13.8
 20260206, 18.1, 11.8
 20260207, 19.1, 10.9
 20260208, 16.7, 13.5
 20260209, 16.9, 14.5
 20260210,  8.8,  9.1
 20260211,  6.6,  7.1
 20260212, 15.8, 10.3
 20260213, 15.3, 12.2
 20260214, 15.9,  9.2
 20260215, 16.2, 10.5
 20260216, 16.6, 13.3
 20260217, 14.3, 11.6
 20260218, 15.1, 13.4
 20260219, 16.1, 14.1
 20260220, 13.8, 10.5
 20260221, 16.6, 10.5
 20260222, 14.2, 11.3
 20260223, 16.2, 12.9
解决方案
与其创建一个不在数据集中的 date_int 变量,不如直接在data.frame中把 Date 强制转换为属于 "Date" 类的对象。
dataset$Date <- as.Date(as.character(dataset$Date), format = "%Y%m%d")
str(dataset)
#> 'data.frame':    23 obs. of  3 variables:
#>  $ Date  : Date, format: "2026-02-01" "2026-02-02" ...
#>  $ TminFc: num  17.8 17.2 17.8 18 16.2 18.1 19.1 16.7 16.9 8.8 ...
#>  $ TminOb: num  13 12.6 13.5 12.9 13.8 11.8 10.9 13.5 14.5 9.1 ...
创建于2026-03-08,使用 reprex v2.1.1
And then change x to aes(x = Date, y = TminFc)。
library(ggplot2)

#Create the plot using ggplot() and geom_line().
ggplot(dataset, aes(x = Date, y = TminFc)) +
  geom_line(color = "red", lwd = 1) +
  labs(title = "WRF 5-d Tmin forecast",
       x = "Date",
       y = "Temp (C)") +
  theme_minimal() +
  # Customize x-axis labels
  scale_x_date(date_labels = "%b %Y", date_breaks = "5 days")
注意
如果你想保持原始数据不变,可以使用包 dplyr,用 mutate 进行强制转换再通过管道传给 ggplot。在这种情况下必须省略 ggplot 的data参数。
library(dplyr)

dataset %>%
  mutate(Date = as.Date(as.character(dataset$Date), format = "%Y%m%d")) %>%
  ggplot(aes(x = Date, y = TminFc)) +
  [... rest of code ...]
编辑
作为对 comment 的后续回复,
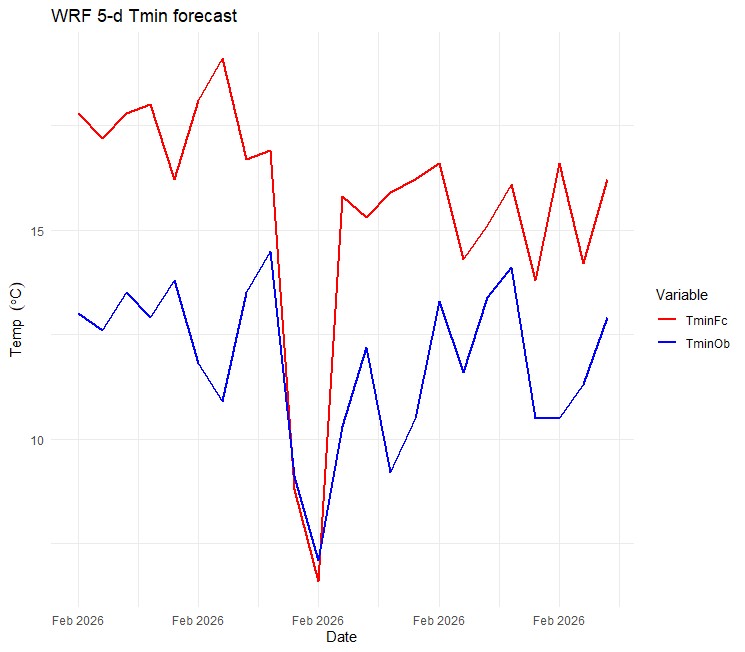
Hello again, I know I have to make a new post, but really quickly is it possible to add me a line or two so that i can plot both variables? Thanks
这类问题通常与数据的重塑有关。数据应为长格式,而当前数据为宽格式。请参阅 this post,了解如何将数据从宽格式重塑为长格式。
我使用 tidyr::pivot_longer 对数据进行重塑。其他改动包括
- 一个颜色向量,用于自定义绘图;
- 一个新的y 轴标题,用于在摄氏度中显示度数符号。
library(ggplot2)
library(dplyr)
#>
#> Attaching package: 'dplyr'
#> The following objects are masked from 'package:stats':
#>
#>     filter, lag
#> The following objects are masked from 'package:base':
#>
#>     intersect, setdiff, setequal, union

# create a colors vector
clrs <- c(TminFc = "red", TminOb = "blue")

dataset %>%
  mutate(Date = as.Date(as.character(dataset$Date), format = "%Y%m%d")) %>%
  tidyr::pivot_longer(
    cols = starts_with("Tmin"),
    names_to = "Variable",
    values_to = "Temp"
  ) %>%
  ggplot(aes(x = Date, y = Temp, color = Variable)) +
  geom_line(linewidth = 1) +
  # set the colors chosen above
  scale_color_manual(values = clrs) +
  labs(title = "WRF 5-d Tmin forecast",
       x = "Date",
       y = expression(Temp~~(degree*C))) +
  theme_minimal() +
  # Customize x-axis labels
  scale_x_date(date_labels = "%b %Y", date_breaks = "5 days")
创建于2026-03-08,使用 reprex v2.1.1
数据以 dput 格式。
dataset <-
  structure(list(Date = 20260201:20260223,
                 TminFc = c(17.8, 17.2, 17.8, 18, 16.2, 18.1, 19.1, 16.7,
                            16.9, 8.8, 6.6, 15.8, 15.3, 15.9, 16.2, 16.6,
                            14.3, 15.1, 16.1, 13.8, 16.6, 14.2, 16.2),
                 TminOb = c(13, 12.6, 13.5, 12.9, 13.8, 11.8, 10.9, 13.5,
                            14.5, 9.1, 7.1, 10.3, 12.2, 9.2, 10.5, 13.3,
                            11.6, 13.4, 14.1, 10.5, 10.5, 11.3, 12.9)),
            row.names = c(NA, -23L), class = "data.frame")
站内所有文章版权归属LeftHeroAI导航站,无授权禁止任何主体转载、抄袭、复制内容,亦不得私自架设镜像站点。一经侵权,本站将通过法律途径追责。
相关文章






汇集全球数千款 AI 工具,每日持续更新,配套 AI 开发学习资源,轻松用 AI 提升工作效率。快捷键 Ctrl+D/⌘+D 一键收藏本站。