


ggplot2的极坐标图:一条能绕着图形画出完整一圈的线条
我在用ggplot2尝试在极坐标图上可视化角度。当我只绘制点时效果很好,但在点之间连线就不太对劲:数据从 -π 跳到 π 时,连线会在图形上额外绕一圈。看这里:
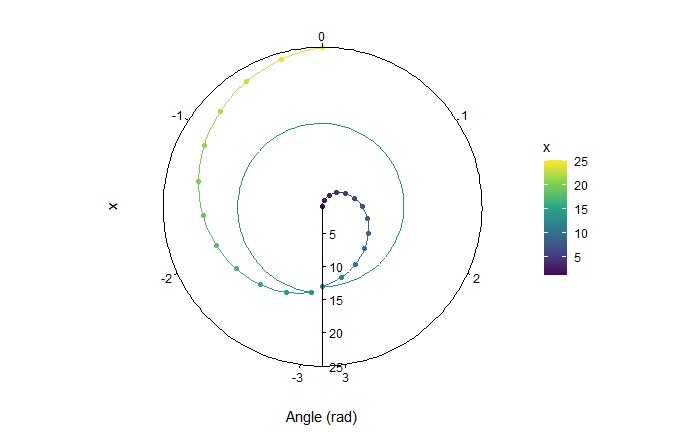
(我对ggplot2相当坚持,如果可能的话,我宁愿不切换到plotly。)
下面给出一些示例数据和可复现该图的代码:
test = data.frame(x= 1:25,
                  theta = c(seq(0, pi, length.out=13), seq(-pi+pi/25, 0, length.out=12)))

ggplot(test, aes(x= x, y =theta, color = x))+
  geom_line()+
  geom_point()+
  scale_color_viridis_c("x")+
  coord_radial(theta = "y", start=pi,  clip= "off", r.axis.inside = T, expand=F, rotate.angle = T)+scale_y_continuous(limits = c(-pi, pi))+
  xlab("x")+ylab("Angle (rad)")
如何通过最短路径把线连接起来,也就是跨过 π/-π 而不会再出现额外的圆环?
解决方案
按照评论中的建议,下面给出一个变通做法:把 [-π, 0] 区域映射到 [π, 2π],并相应调整坐标标签。
编辑——我已经调整了逻辑,以跟踪当前处于哪个“循环”,使得最后一行位于2π 而不是0。这使得可以与倒数第二个点相连。我认为,这种方法的一个缺点是它仅限于在 ±π 的步进变化,但对我而言,这样的假设是合理的。
library(dplyr) # in addition to ggplot2, obviously
test |>
  mutate(theta_delta_constrained = (theta - lag(theta, 1, 0) + pi) %% (2*pi) - pi,
         theta2 = first(theta) + cumsum(theta_delta_constrained)) |>
ggplot(aes(x = x, y = theta2, color = x)) +
  geom_line() +
  geom_point() +
  scale_color_viridis_c("x") +
  coord_radial(theta = "y", start=0,  clip= "off",
               r.axis.inside = T, expand=F, rotate.angle = T) +
  scale_y_continuous(limits = c(0, 2*pi),
                     breaks = c(0:3, 2*pi - c(1:3)),
                     labels = c(0:3, -(1:3))) +
  xlab("x") +
  ylab("Angle (rad)")
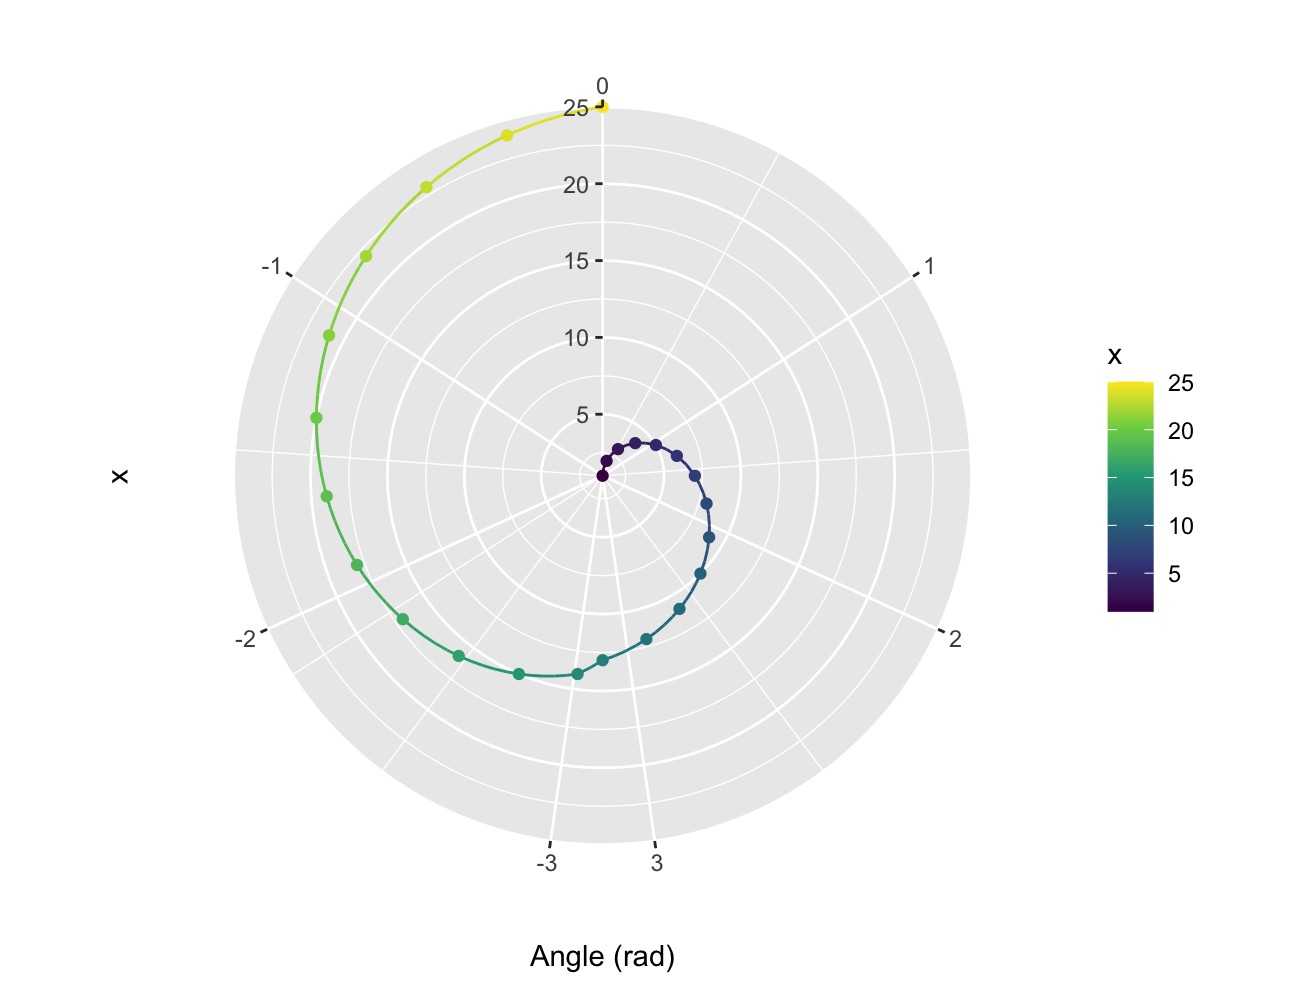
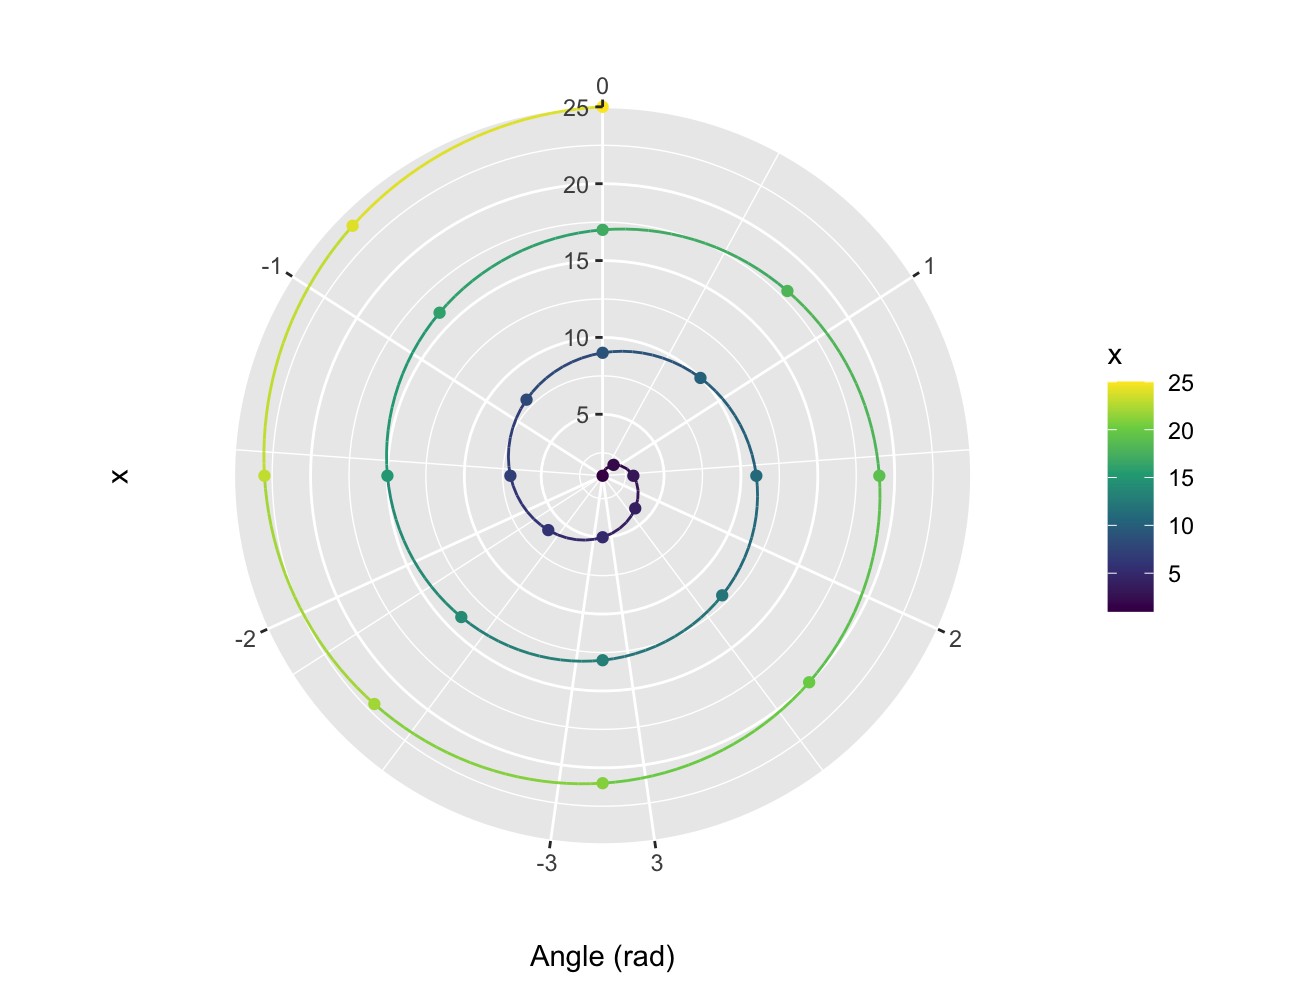
这种方法适用于跨越多个周期的数据,例如:
test = data.frame(x= 1:25,
                  theta = ((seq(0, 6*pi, length.out = 25) + pi) %% (2*pi)) - pi)
...前提是从 scale_y_continuous 中移除 limits 参数,并改用以下方法(原因见 https://r4ds.hadley.nz/communication.html#zooming,但已改为极坐标系的情形)
coord_radial(theta = "y", start=0, clip= "off", thetalim = c(0, 2*pi),
             r.axis.inside = T, expand=F, rotate.angle = T)
我们的结果:
站内所有文章版权归属LeftHeroAI导航站,无授权禁止任何主体转载、抄袭、复制内容,亦不得私自架设镜像站点。一经侵权,本站将通过法律途径追责。
相关文章






汇集全球数千款 AI 工具,每日持续更新,配套 AI 开发学习资源,轻松用 AI 提升工作效率。快捷键 Ctrl+D/⌘+D 一键收藏本站。