


如何在emmeans中对对比进行逐对比较
我需要对三个对比使用emmeans进行成对比较。
下面是示例数据和模型。一个二水平因子(anxiety)嵌在一个三水平因子(group)之内。二元结果变量。
library(emmeans)


set.seed(1)

noAnxiety_g1 <- sample(x = factor(sample(x = c("a", "b"),
                                  size = 20,
                                  replace = TRUE,
                                  prob = c(0.3, 0.7))))

anxiety_g1 <- sample(x = factor(sample(x = c("a", "b"),
                                       size = 20,
                                       replace = TRUE,
                                       prob = c(0.7, 0.3))))

noAnxiety_g2 <- sample(x = factor(sample(x = c("a", "b"),
                                  size = 20,
                                  replace = TRUE,
                                  prob = c(0.7, 0.3))))

anxiety_g2 <- sample(x = factor(sample(x = c("a", "b"),
                                size = 20,
                                replace = TRUE,
                                prob = c(0.3, 0.7))))

noAnxiety_g3 <- sample(x = factor(sample(x = c("a", "b"),
                                         size = 20,
                                         replace = TRUE,
                                         prob = c(0.5, 0.5))))

anxiety_g3 <- sample(x = factor(sample(x = c("a", "b"),
                                       size = 20,
                                       replace = TRUE,
                                       prob = c(0.1, 0.9))))


d <- data.frame(outcome = c(noAnxiety_g1, anxiety_g1, noAnxiety_g2, anxiety_g2, noAnxiety_g3, anxiety_g3),
                anxiety = factor(x = rep(x = c("noAnxiety", "anxiety"), each = 20, length.out = 120),
                                 levels = c("noAnxiety", "anxiety")),
                group = factor(x = rep(x = c("g1", "g2", "g3"), each = 40, length.out = 120),
                               levels = c("g1", "g2", "g3")))


glm(formula = outcome ~ anxiety*group,
    data = d,
    family = binomial) -> mod
当我们在响应尺度上绘制交互作用时,使用 emmip 函数
emmip(object = mod,
      formula = group ~ anxiety,
      type = "response",
      CIs = FALSE,
      ylab = "Probability of event",
      xlab = "Anxiety")
得到下图如下。
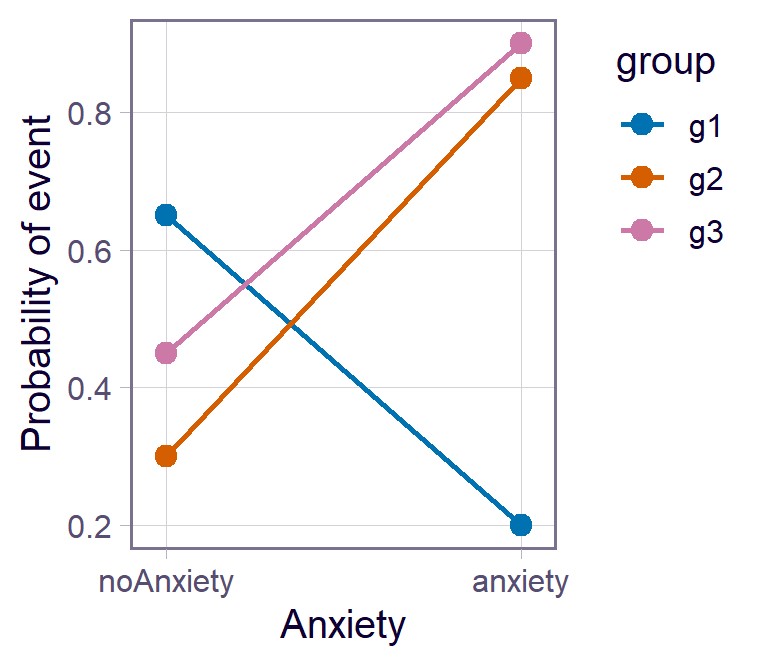
交互作用相当明显。现在我想在这三个组之间,获得 noAnxiety 与 anxiety 组在事件发生率变化上的差异估计。
通过 emmeans 运行模型
emmeans(object = mod,
        specs =  ~ anxiety|group) -> emAnx

emAnx

# group = g1:
# anxiety   emmean    SE  df asymp.LCL asymp.UCL
# noAnxiety  0.619 0.469 Inf    -0.300     1.538
# anxiety   -1.386 0.559 Inf    -2.482    -0.291
#
# group = g2:
# anxiety   emmean    SE  df asymp.LCL asymp.UCL
# noAnxiety -0.847 0.488 Inf    -1.804     0.109
# anxiety    1.735 0.626 Inf     0.507     2.962
#
# group = g3:
# anxiety   emmean    SE  df asymp.LCL asymp.UCL
# noAnxiety -0.201 0.449 Inf    -1.082     0.680
# anxiety    2.197 0.745 Inf     0.736     3.658
#
# Results are given on the logit (not the response) scale.
# Confidence level used: 0.95
现在我尝试了这个
# now let's test
contrast(emAnx,
         interaction = c("consec", "consec"), by = NULL) -> contAnx

contAnx

# output
# anxiety_consec      group_consec estimate   SE  df z.ratio p.value
# anxiety - noAnxiety g2 - g1         4.587 1.08 Inf   4.254 <0.0001
# anxiety - noAnxiety g3 - g2        -0.184 1.18 Inf  -0.156  0.8759
#
# Results are given on the log odds ratio (not the response) scale.
这给出了我想要的三次比较中的两次,但漏掉了 g3-g1。
在emmeans中有很多做法,但我找不到我想要的方法。
解决方案
在对 interaction 的调用中,改用 "pairwise",而不是 "consec":
library(emmeans)
#> Welcome to emmeans.
#> Caution: You lose important information if you filter this package's results.
#> See '? untidy'
d <- structure(list(outcome = structure(c(2L, 1L, 2L, 1L, 1L, 2L,
1L, 2L, 2L, 2L, 2L, 2L, 1L, 2L, 1L, 2L, 2L, 2L, 2L, 1L, 1L, 2L,
1L, 1L, 1L, 1L, 1L, 2L, 2L, 1L, 1L, 1L, 1L, 1L, 1L, 1L, 1L, 2L,
1L, 1L, 1L, 2L, 1L, 1L, 1L, 1L, 2L, 1L, 1L, 1L, 1L, 1L, 1L, 1L,
2L, 2L, 2L, 2L, 1L, 1L, 2L, 1L, 2L, 2L, 2L, 2L, 2L, 2L, 2L, 2L,
2L, 2L, 2L, 2L, 2L, 1L, 2L, 2L, 2L, 1L, 2L, 2L, 2L, 1L, 2L, 2L,
1L, 1L, 2L, 1L, 2L, 2L, 2L, 1L, 1L, 1L, 1L, 1L, 1L, 1L, 2L, 2L,
2L, 2L, 2L, 2L, 2L, 2L, 2L, 2L, 2L, 1L, 2L, 1L, 2L, 2L, 2L, 2L,
2L, 2L), levels = c("a", "b"), class = "factor"), anxiety = structure(c(1L,
1L, 1L, 1L, 1L, 1L, 1L, 1L, 1L, 1L, 1L, 1L, 1L, 1L, 1L, 1L, 1L,
1L, 1L, 1L, 2L, 2L, 2L, 2L, 2L, 2L, 2L, 2L, 2L, 2L, 2L, 2L, 2L,
2L, 2L, 2L, 2L, 2L, 2L, 2L, 1L, 1L, 1L, 1L, 1L, 1L, 1L, 1L, 1L,
1L, 1L, 1L, 1L, 1L, 1L, 1L, 1L, 1L, 1L, 1L, 2L, 2L, 2L, 2L, 2L,
2L, 2L, 2L, 2L, 2L, 2L, 2L, 2L, 2L, 2L, 2L, 2L, 2L, 2L, 2L, 1L,
1L, 1L, 1L, 1L, 1L, 1L, 1L, 1L, 1L, 1L, 1L, 1L, 1L, 1L, 1L, 1L,
1L, 1L, 1L, 2L, 2L, 2L, 2L, 2L, 2L, 2L, 2L, 2L, 2L, 2L, 2L, 2L,
2L, 2L, 2L, 2L, 2L, 2L, 2L), levels = c("noAnxiety", "anxiety"
), class = "factor"), group = structure(c(1L, 1L, 1L, 1L, 1L,
1L, 1L, 1L, 1L, 1L, 1L, 1L, 1L, 1L, 1L, 1L, 1L, 1L, 1L, 1L, 1L,
1L, 1L, 1L, 1L, 1L, 1L, 1L, 1L, 1L, 1L, 1L, 1L, 1L, 1L, 1L, 1L,
1L, 1L, 1L, 2L, 2L, 2L, 2L, 2L, 2L, 2L, 2L, 2L, 2L, 2L, 2L, 2L,
2L, 2L, 2L, 2L, 2L, 2L, 2L, 2L, 2L, 2L, 2L, 2L, 2L, 2L, 2L, 2L,
2L, 2L, 2L, 2L, 2L, 2L, 2L, 2L, 2L, 2L, 2L, 3L, 3L, 3L, 3L, 3L,
3L, 3L, 3L, 3L, 3L, 3L, 3L, 3L, 3L, 3L, 3L, 3L, 3L, 3L, 3L, 3L,
3L, 3L, 3L, 3L, 3L, 3L, 3L, 3L, 3L, 3L, 3L, 3L, 3L, 3L, 3L, 3L,
3L, 3L, 3L), levels = c("g1", "g2", "g3"), class = "factor")), class = "data.frame", row.names = c(NA,
-120L))
mod <- glm(formula = outcome ~ anxiety*group,
    data = d,
    family = binomial) -> mod

emAnx <- emmeans(object = mod,
          specs =  ~ anxiety|group) -> emAnx

ctrAnx <- contrast(emAnx,
         interaction = c("pairwise", "pairwise"),
         by=NULL)

ctrAnx
#>  anxiety_pairwise    group_pairwise estimate   SE  df z.ratio p.value
#>  noAnxiety - anxiety g1 - g2           4.587 1.08 Inf   4.254 <0.0001
#>  noAnxiety - anxiety g1 - g3           4.403 1.14 Inf   3.877  0.0001
#>  noAnxiety - anxiety g2 - g3          -0.184 1.18 Inf  -0.156  0.8759
#>
#> Results are given on the log odds ratio (not the response) scale.
创建于2026-05-12,使用 reprex v2.1.1
站内所有文章版权归属LeftHeroAI导航站,无授权禁止任何主体转载、抄袭、复制内容,亦不得私自架设镜像站点。一经侵权,本站将通过法律途径追责。
相关文章






汇集全球数千款 AI 工具,每日持续更新,配套 AI 开发学习资源,轻松用 AI 提升工作效率。快捷键 Ctrl+D/⌘+D 一键收藏本站。