


Excel VBA在将数据透视图标签移动若干点时出现的问题
说明一下,我需要阻止这种向右偏移。这是怎么产生的,应该如何阻止它发生?
我在14本工作簿的每一本里都有大量数据透视图——除了所针对的实体(FQHC)不同,其它都一样。它们显示质量指标的表现。每张图表里有三条线:目标值(在每个横轴数值上都是相同的数值)、FQHC的表现,以及Org的表现。多年来,在每次刷新数据时,我都要手动移动标签,针对在某点相交的线条。我希望较高的数据点的标签位于数据点之上,较低的数据点的标签位于数据点之下。我对简单的图表也一直在使用图表模板。
我只是想用VBA把它们移动到正确的位置。借助人工智能(AI),上周我已经让一切都正常工作,包括处理“特殊”情形,比如两个数据点的值都是0.00%。我还设定了如果两者相等但不是0.00% 的情况。上周一切都很完美。周一打开工作簿时,情形变得一团糟(我只是打开它,什么也没做)。所有图表的数据标签都包含类别名、系列名、图例键和引线——而不仅仅是数值。我去找AI了解原因,但没有任何效果;大多数建议要么让情况更糟,要么没有改变。我现在在其中加入了一些语句,试图抑制数据标签中的多余杂项。
将数据标签“上方”与“下方”移动本身并不成问题。但对于像两者都是0.00% 这样的特殊情况,我遇到了很多麻烦。我只是把每个标签都定位在标记点的上方,然后再把其中一个向上略微移动,另一个向下略微移动。但它们一开始显示时应该是正确的(路途确实很长,我已经记不清很多细节),随后它们都移到了数据点标记的右侧,而不是在上方(其实它们是正确地堆叠在一起的)。AI说(以及其他一些观点)你不能用“数学”的方式移动数据透视图标签(例如把一个标签往上移动x 个单位,另一个往下移动同样的x 个单位)。你会在代码中看到,AI尝试“把标签从Excel的动态令牌容器中拉出”,并且还尝试了一些文本边距等做法,说实话,是一些我没跟上的做法。
我还附上一个工作图表,在该图中线条相交,VBA成功地将它们简单地上下移动到相应位置。
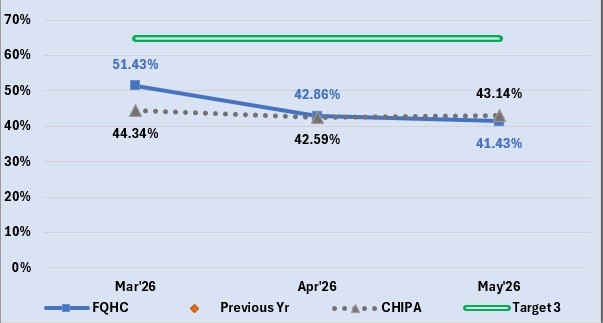
以下是我的问题在第一个数据点的一个示例——我还有其他代码块用于把较低的百分比值保持在x 轴之外,但现在它们也出现了同样的“向右漂移”问题,因此我现在不再运行它们。
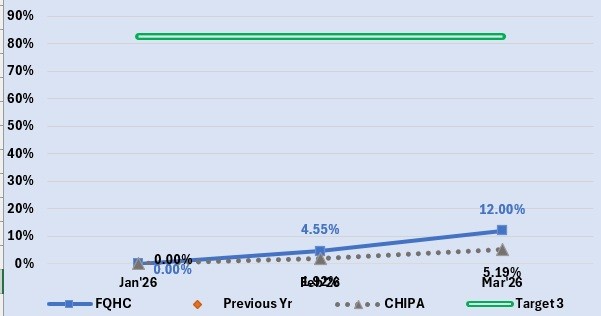
这是在两者都是0% 时的我的代码(我试图把它格式化为代码块,但看起来不太对)。如果我本可以用不同的方式来书写这段代码,请见谅。
Sub AlignDataLabelsByValue(chart_name As String, sheet_name As String)
    Dim cht As Chart
    Dim sFQHC As Series, sOrg As Series
    Dim i As Long
    Dim PointsToMove As Double
    Dim valFQHC As Double
    Dim valOrg As Double
    Dim CorrectLeft As Double
    PointsToMove = 3# ' standard offset spacing variable

    ' Connect directly to the specific target chart container
    Set cht = Worksheets(sheet_name).ChartObjects(chart_name).Chart
    Set sFQHC = cht.SeriesCollection("FQHC")
    Set sOrg = cht.SeriesCollection("CHIPA")

    sFQHC.HasLeaderLines = False
    sOrg.HasLeaderLines = False


    ' Loop through every month/data point
    For i = 1 To sFQHC.Points.Count

    ' make sure there is a label before formatting it
        sFQHC.Points(i).HasDataLabel = True
    ' make sure there is a label before formatting it
        sOrg.Points(i).HasDataLabel = True

    ' Hard-lock the content types wanted
    ' since they showed up randomly after closing the workbook
        With sFQHC.Points(i).DataLabel
            .ShowValue = True
            .ShowSeriesName = False
            .ShowCategoryName = False
            .ShowLegendKey = False
        End With
        With sOrg.Points(i).DataLabel
            .ShowValue = True
            .ShowSeriesName = False
            .ShowCategoryName = False
            .ShowLegendKey = False
        End With


    ' Make sure both data points exist and are not #N/A
    If IsNumeric(sFQHC.Values(i)) And IsNumeric(sOrg.Values(i)) Then

        valFQHC = sFQHC.Values(i)
        valOrg = sOrg.Values(i)


        ' --- CONDITION 1: BOTH POINTS ARE EXACTLY 0 ---
        If valFQHC = 0 And valOrg = 0 Then
        MsgBox "VBA entered the 0% rule for point " & i & " for " & chart_name

        '--> pull the labels out of Excel's dynamic token container
        ' AI HAD ME ADD THIS AND IT DID NOT CHANGE ANYTHING
            sFQHC.Points(i).DataLabel.AutoText = False
            sOrg.Points(i).DataLabel.AutoText = False


         ' --> Position them at the default Above baseline
         sFQHC.Points(i).DataLabel.Position = xlLabelPositionAbove
         sOrg.Points(i).DataLabel.Position = xlLabelPositionAbove


        ' --> Move sFQHC Vertically & Snap it Horizontally
         CorrectLeft = sFQHC.Points(i).DataLabel.Left     ' Captures FQHC's true center
         sFQHC.Points(i).DataLabel.Top = sFQHC.Points(i).DataLabel.Top + PointsToMove
         sFQHC.Points(i).DataLabel.Left = CorrectLeft     ' Locks FQHC center


        ' --> Move sOrg Vertically & Snap it Horizontally
         CorrectLeft = sOrg.Points(i).DataLabel.Left      ' Overwrites variable with Org's true center
         sOrg.Points(i).DataLabel.Top = sOrg.Points(i).DataLabel.Top - PointsToMove
         sOrg.Points(i).DataLabel.Left = CorrectLeft      ' Locks Org center

         ' there is an elseif below to continue other situations
如果有人能就标签向右漂移的问题提供一些见解,我将不胜感激。
解决方案
请在每次数据透视表更新后,执行如下的标签定位代码:
Private Sub Worksheet_PivotTableUpdate(ByVal Target As PivotTable)

    Dim dl As DataLabel

    With Me.ChartObjects("Chart 1").Chart
        Set dl = .SeriesCollection(1).Points(1).DataLabel

        dl.Position = xlLabelPositionCustom
        dl.Left = dl.Left + 10
        dl.Top = dl.Top - 5
    End With

End Sub
相关文章





